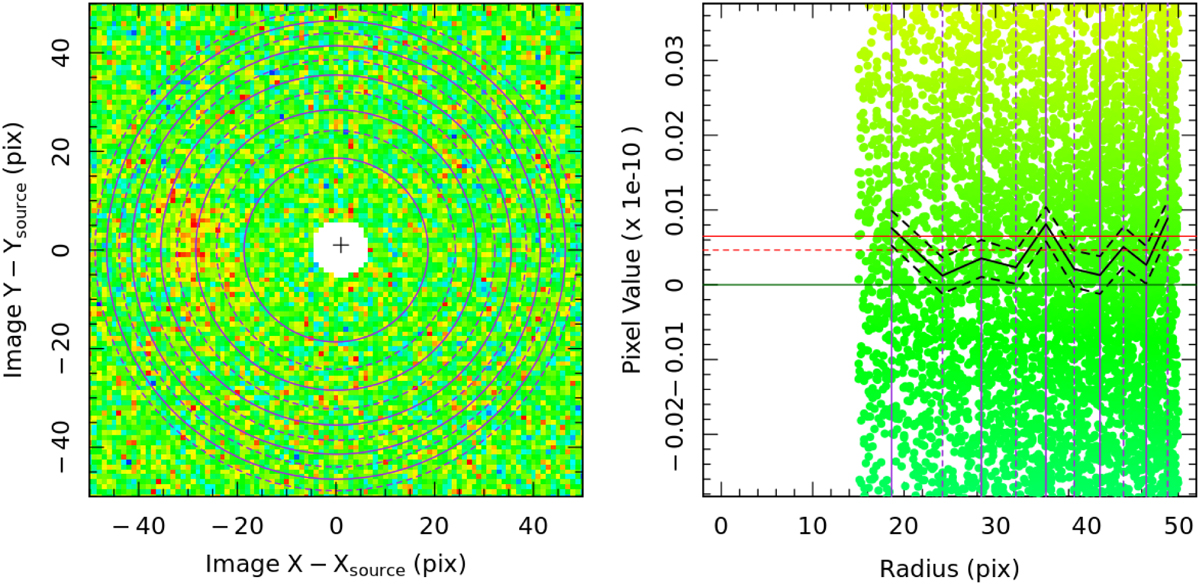
Fig. A.2
Download original image
Uncorrelated background estimated using the LAMBDAR sky-estimate routine. Left: Annuli used to estimate the background estimates, shown against the input image (colour mapping for pixels in the left panel is given by the point colouring in the right panel). Right: Distribution of pixel values (points) as a function of radius from the random location chosen. The black lines show the median sky value per annulus (solid) and the uncertainty on the median (dashed). The final mean (median) sky estimate is shown as the solid (dashed) red line. This figure is a direct output of the LAMBDAR code.
Current usage metrics show cumulative count of Article Views (full-text article views including HTML views, PDF and ePub downloads, according to the available data) and Abstracts Views on Vision4Press platform.
Data correspond to usage on the plateform after 2015. The current usage metrics is available 48-96 hours after online publication and is updated daily on week days.
Initial download of the metrics may take a while.