Fig. 6
Download original image
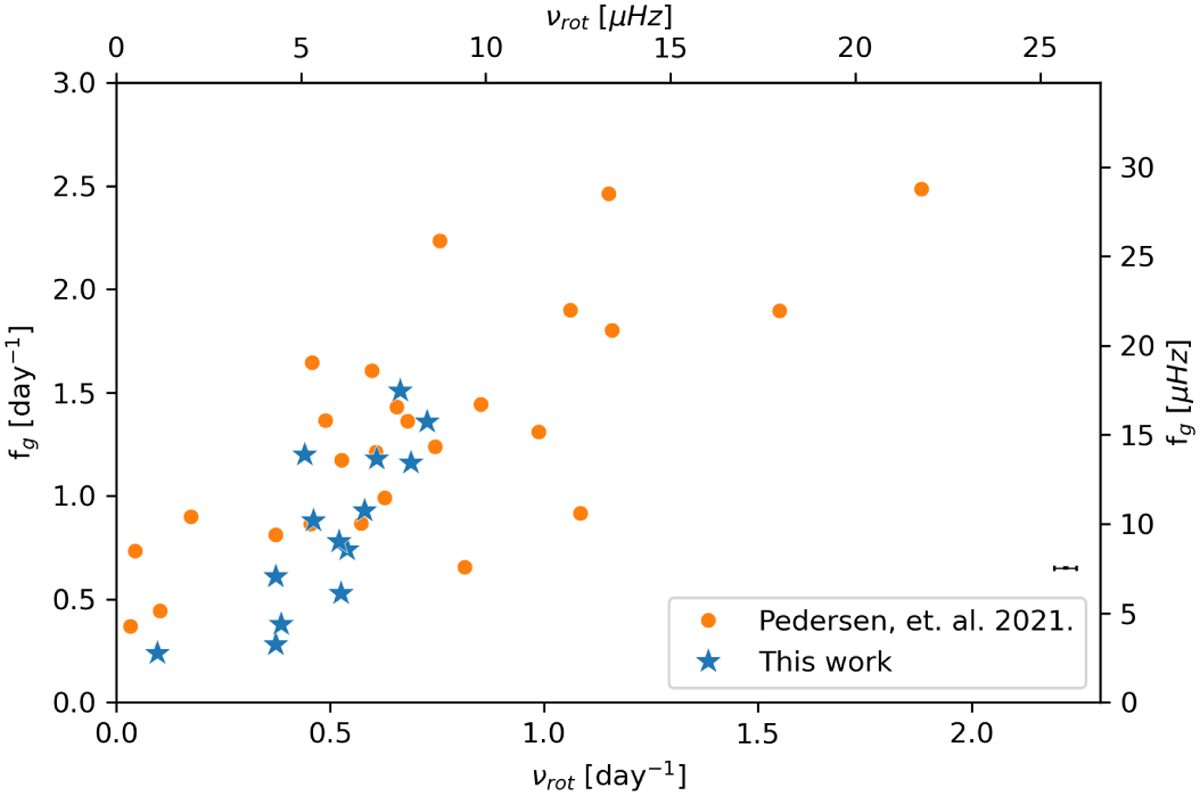
Relationship between the dominant frequency of g-modes fg and the average internal rotation frequency for SPB stars. Blue points represent values deduced using the Takata et al. (2020) method (this work), while orange points are values estimated by Pedersen et al. (2021a) from modeling the dipole period spacing patterns, in a data set from original Kepler mission. Error bars are generally smaller than the plot symbols. The observed trend indicates an increase in the dominant frequency of g-modes with the internal rotation frequency, although the loose correlation suggests that other physical factors are also at play.
Current usage metrics show cumulative count of Article Views (full-text article views including HTML views, PDF and ePub downloads, according to the available data) and Abstracts Views on Vision4Press platform.
Data correspond to usage on the plateform after 2015. The current usage metrics is available 48-96 hours after online publication and is updated daily on week days.
Initial download of the metrics may take a while.