Fig. 4
Download original image
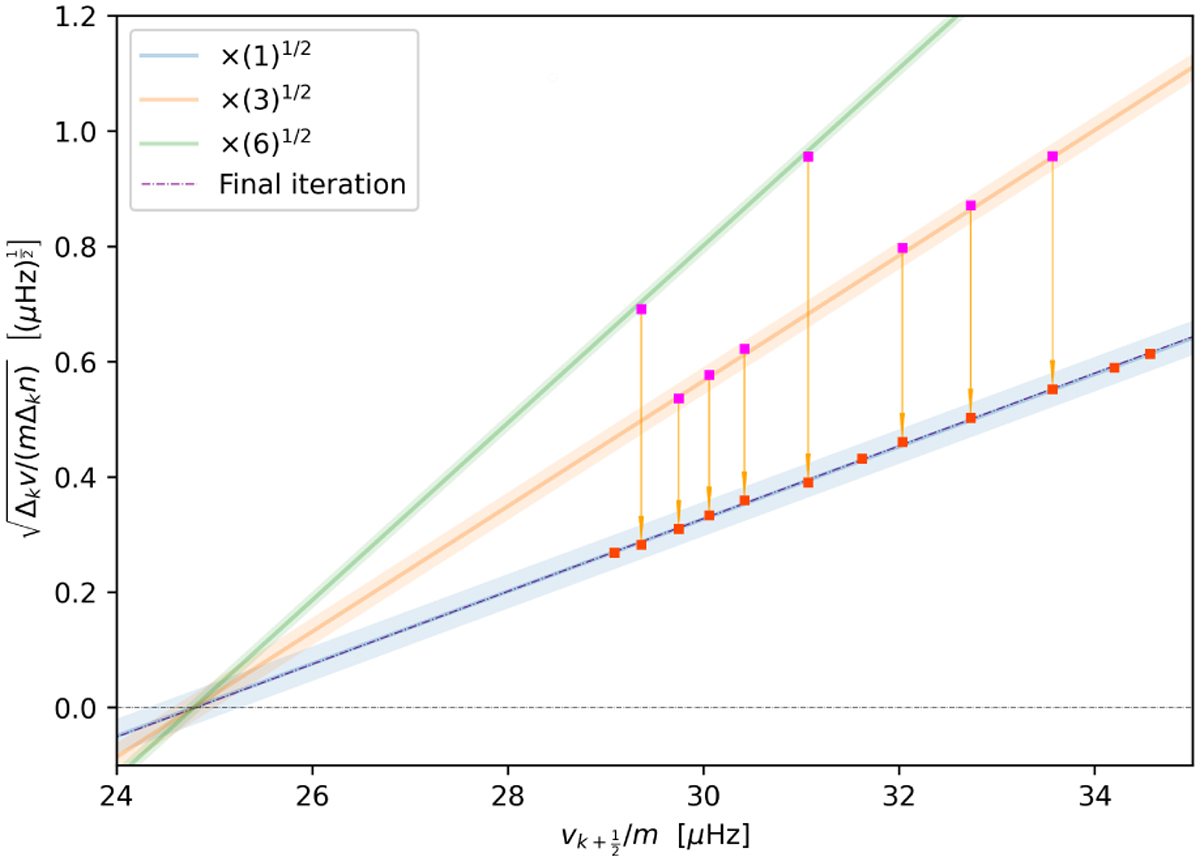
ν versus ![]() diagram for KIC 12066947 obtained from the analysis of all available data. Magenta squares indicate modes with “jumps” in the radial order n, with Δkn of 2, 3, represented by colored lines starting with orange. Red squares indicate modes with Δkn = 1 or corrected by a factor of 1/
diagram for KIC 12066947 obtained from the analysis of all available data. Magenta squares indicate modes with “jumps” in the radial order n, with Δkn of 2, 3, represented by colored lines starting with orange. Red squares indicate modes with Δkn = 1 or corrected by a factor of 1/ ![]() , while yellow arrows indicate when this correction was applied. Open black points were discarded. The solid blue line represents the first iteration, and the purple dashed line indicates the inclination after convergence. The intercept of the dashed line with the 0.0 line estimates the average rotation frequency, and the slope measures P0.
, while yellow arrows indicate when this correction was applied. Open black points were discarded. The solid blue line represents the first iteration, and the purple dashed line indicates the inclination after convergence. The intercept of the dashed line with the 0.0 line estimates the average rotation frequency, and the slope measures P0.
Current usage metrics show cumulative count of Article Views (full-text article views including HTML views, PDF and ePub downloads, according to the available data) and Abstracts Views on Vision4Press platform.
Data correspond to usage on the plateform after 2015. The current usage metrics is available 48-96 hours after online publication and is updated daily on week days.
Initial download of the metrics may take a while.