Fig. 2
Download original image
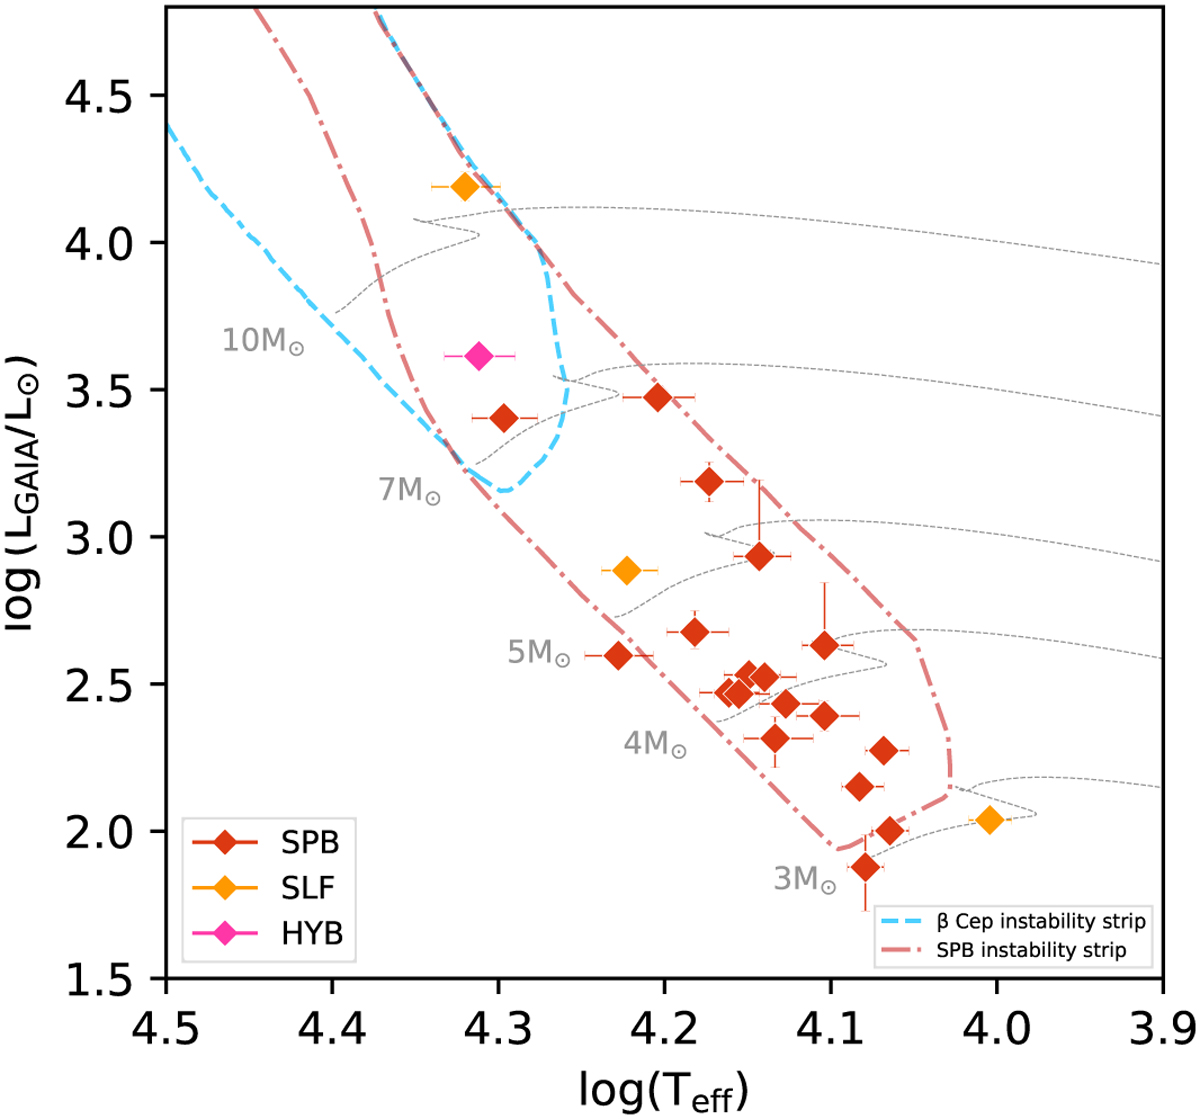
HR diagram of our target stars with spectra in the blue region. The luminosity came from Gaia DR3 data bolometric corrected (see Sect. 5.3 for details). The effective temperatures were deduced with the SME package (see Sect. 5). The colors in the diagram represent the type of stellar variability. The instability strips calculated by Miglio et al. (2007) for β Cep and SPB stars are also shown. Some evolutionary tracks have been plotted to provide further information. The error bars in the diagram represent the uncertainties discussed in the text.
Current usage metrics show cumulative count of Article Views (full-text article views including HTML views, PDF and ePub downloads, according to the available data) and Abstracts Views on Vision4Press platform.
Data correspond to usage on the plateform after 2015. The current usage metrics is available 48-96 hours after online publication and is updated daily on week days.
Initial download of the metrics may take a while.