Open Access
Fig. E.2
Download original image
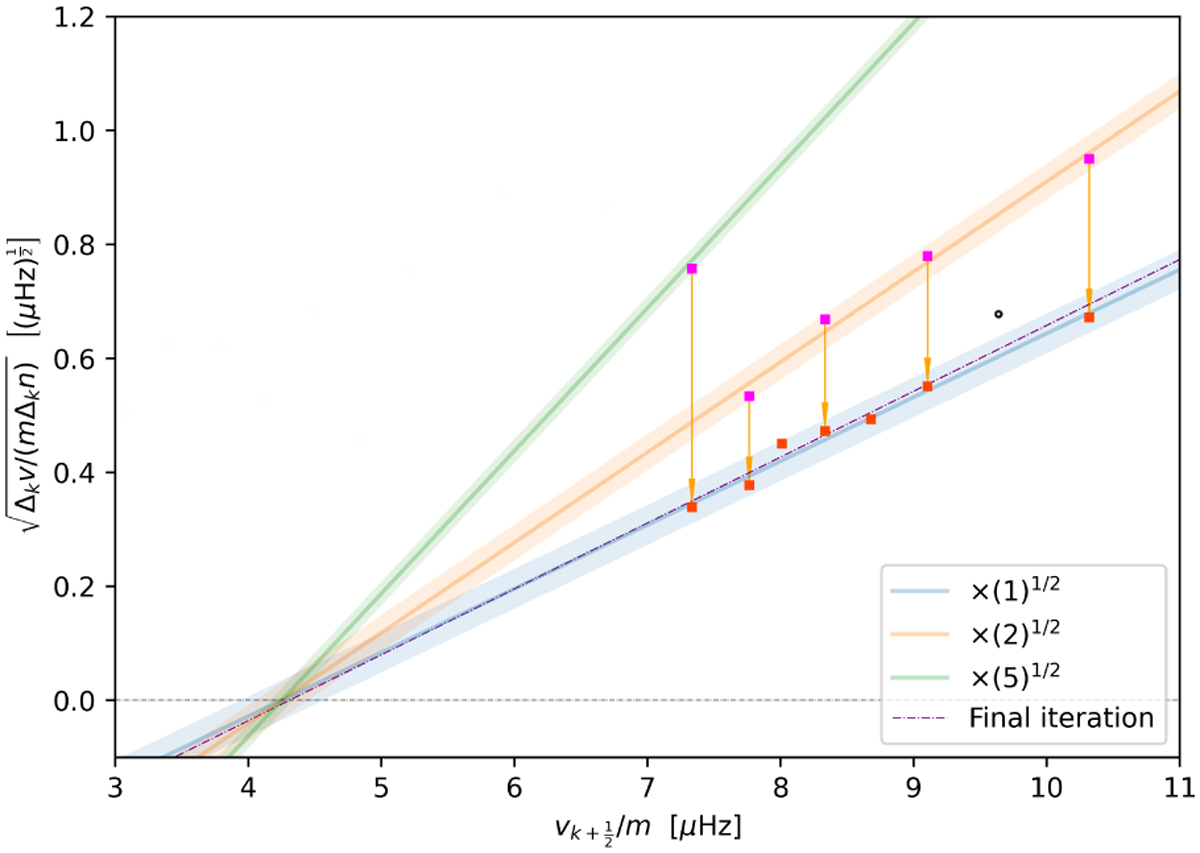
Same details as in Fig. E.1, but for EPIC 223217668. The diagram shows frequencies between 7.0 and 10.8 μHz attributed to prograde sectoral modes with m =1. The results obtained are: vrot = 4.3 ± 0.2 μHz, P0 = 13 ± 1 · 103.
Current usage metrics show cumulative count of Article Views (full-text article views including HTML views, PDF and ePub downloads, according to the available data) and Abstracts Views on Vision4Press platform.
Data correspond to usage on the plateform after 2015. The current usage metrics is available 48-96 hours after online publication and is updated daily on week days.
Initial download of the metrics may take a while.