Fig. 1
Download original image
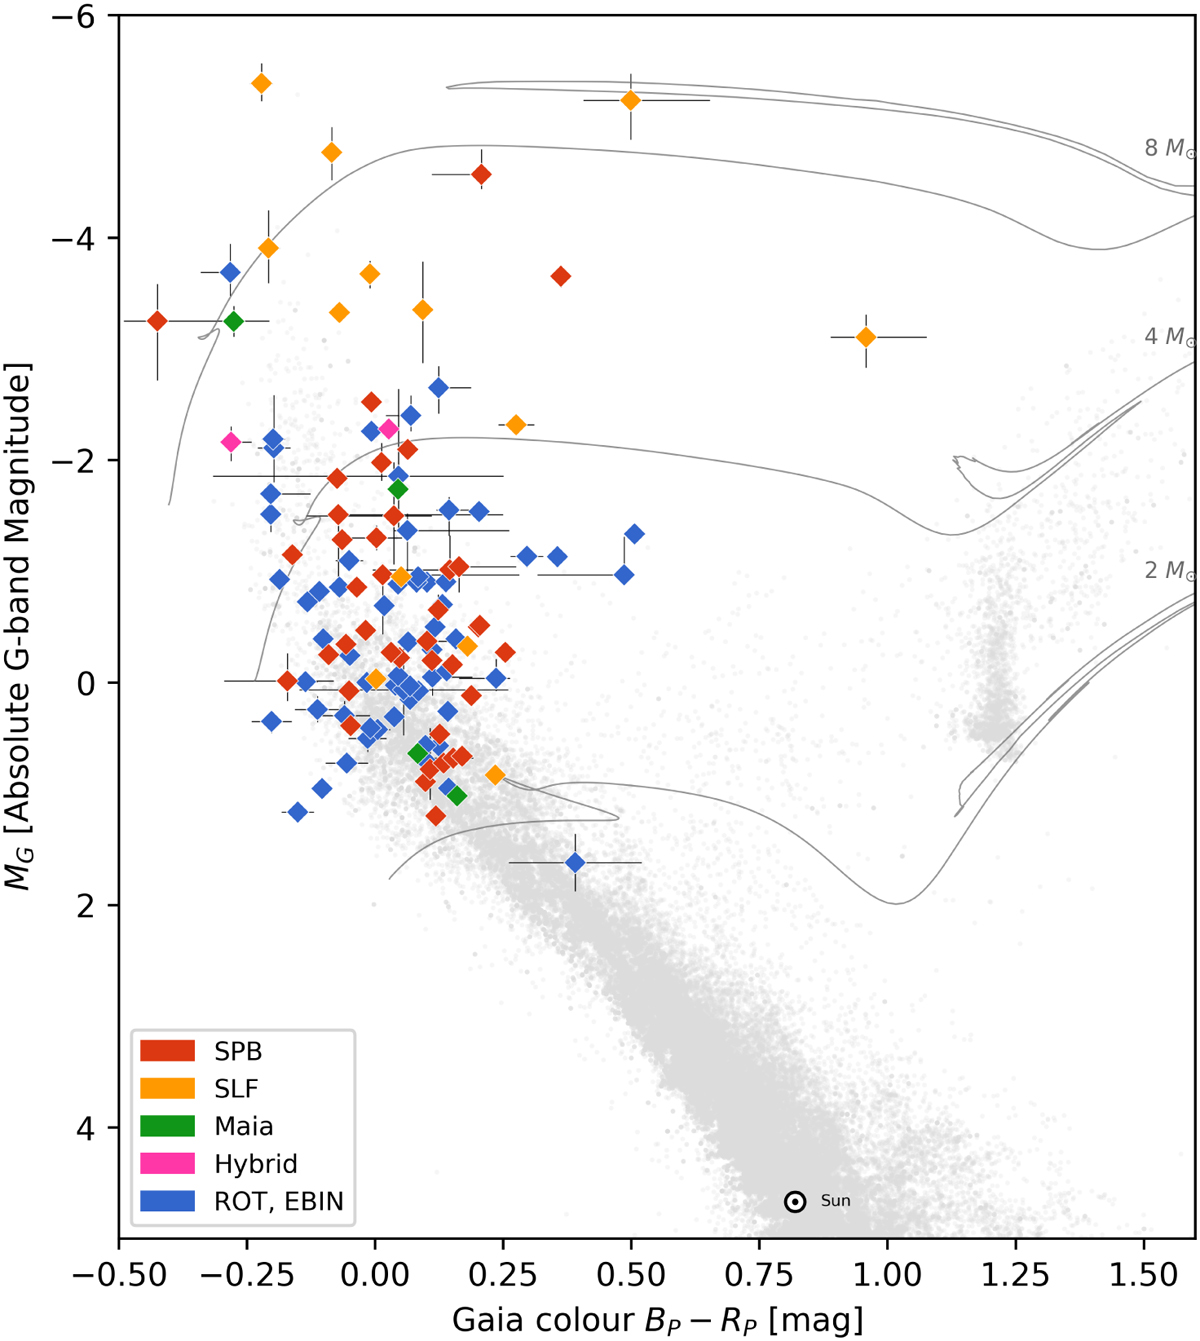
Observational HR Gaia color-magnitude diagram of OBA stars from Campaign 11 of the K2 mission. On the x-axis the Gaia colour is shown, which is the difference in magnitude between the star’s measurement in the blue and red passbands. The y-axis gives the G-band absolute magnitude of the stars. The type of variability is indicate by different colours in the inset. The horizontal error bars represents primarily the uncertainty in the reddening of the stars (Amôres et al. 2021). The vertical error bar results from the sum of the distance uncertainty (Bailer-Jones et al. 2021) and the extinction uncertainty (Amôres et al. 2021). The background of the diagram is populated with gray points, representing 200 000 stars that are used to mark the main sequence and red clump regions, using data from Gaia Collaboration (2018). Evolutionary tracks of MIST for 2, 4, and 8 M⊙ and the position of the Sun as calculated by Casagrande & VandenBerg (2018) are also shown.
Current usage metrics show cumulative count of Article Views (full-text article views including HTML views, PDF and ePub downloads, according to the available data) and Abstracts Views on Vision4Press platform.
Data correspond to usage on the plateform after 2015. The current usage metrics is available 48-96 hours after online publication and is updated daily on week days.
Initial download of the metrics may take a while.