Fig. 17
Download original image
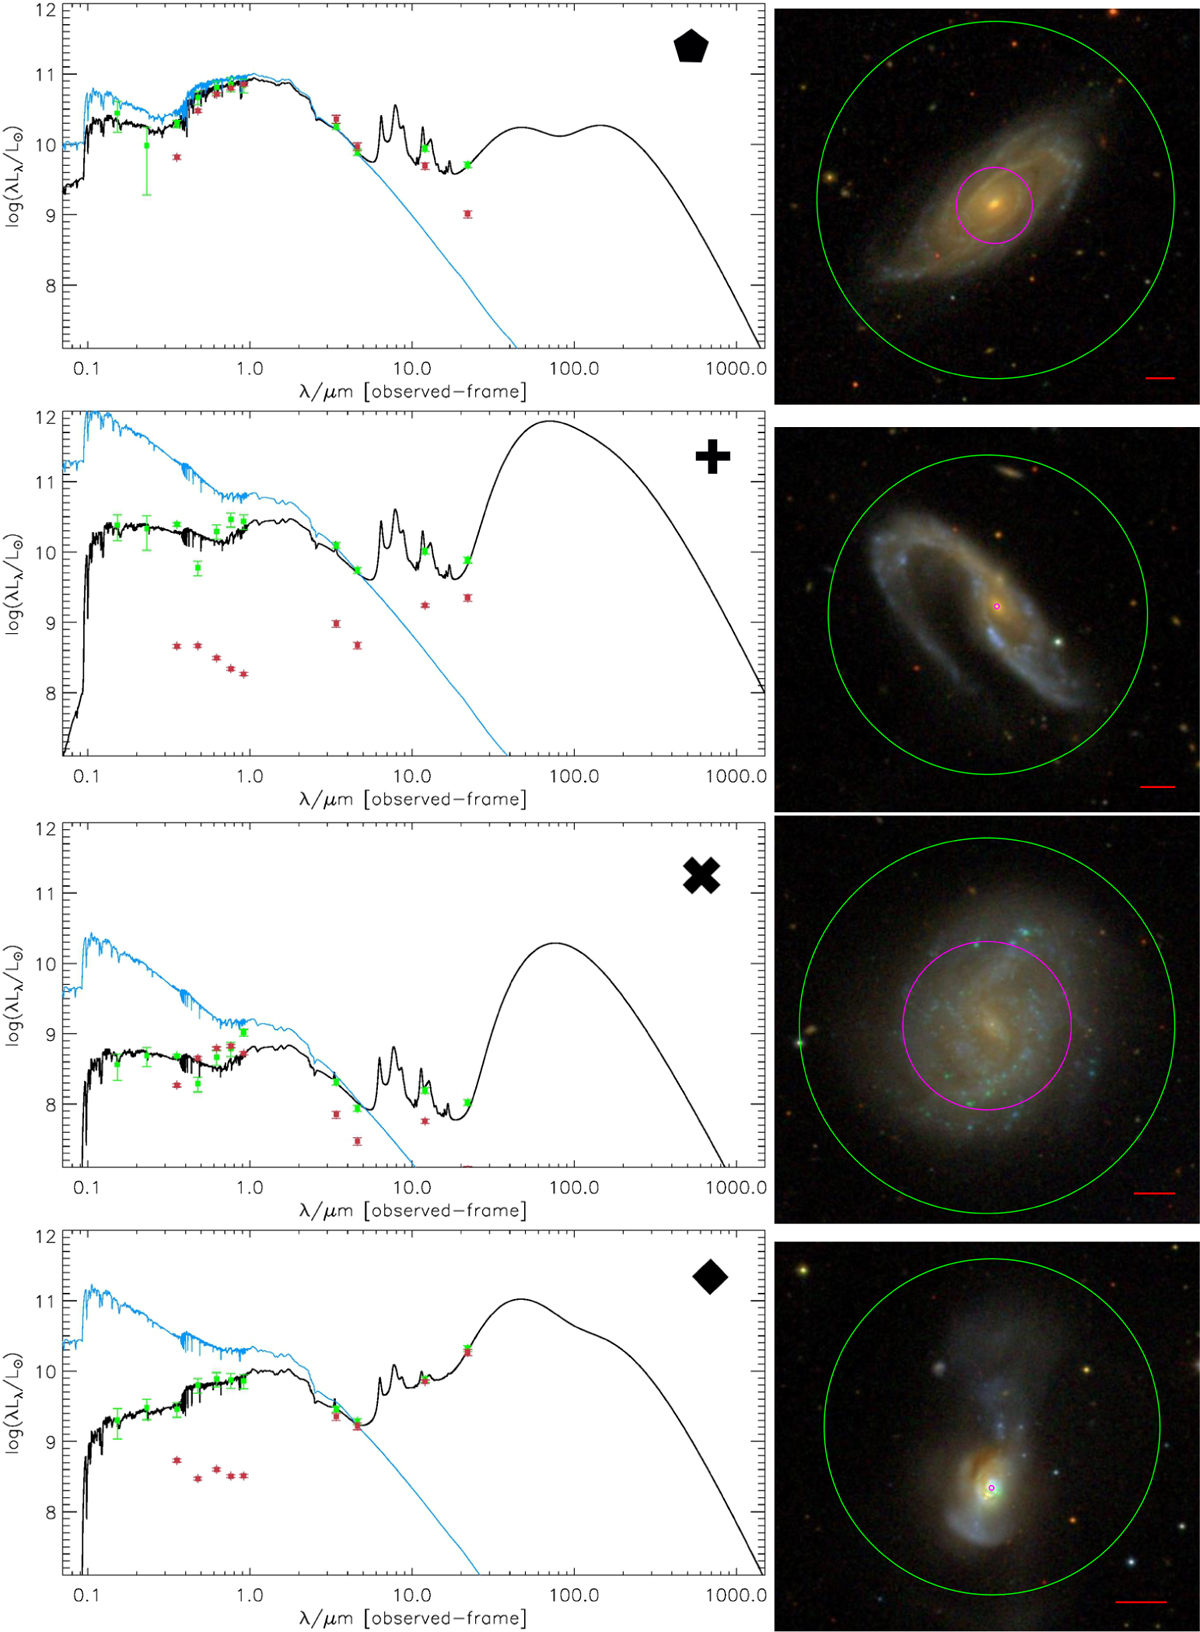
SED and u𝑔riɀ images for galaxies with large differences between our M* and SFR results and the CHANG 15 results. The symbol shown in the top right corner of each SED corresponds to the galaxy symbol in Fig. 16. The black and blue lines show the attenuated and unattenuated SED fit to our measurements in green. The red dots show the fluxes used by CHANG 15. The u𝑔riɀ image show the apertures measured in our study in green and the one measured by SDSS in magenta. The red line represents 20″ in each image.
Current usage metrics show cumulative count of Article Views (full-text article views including HTML views, PDF and ePub downloads, according to the available data) and Abstracts Views on Vision4Press platform.
Data correspond to usage on the plateform after 2015. The current usage metrics is available 48-96 hours after online publication and is updated daily on week days.
Initial download of the metrics may take a while.