Fig. 16
Download original image
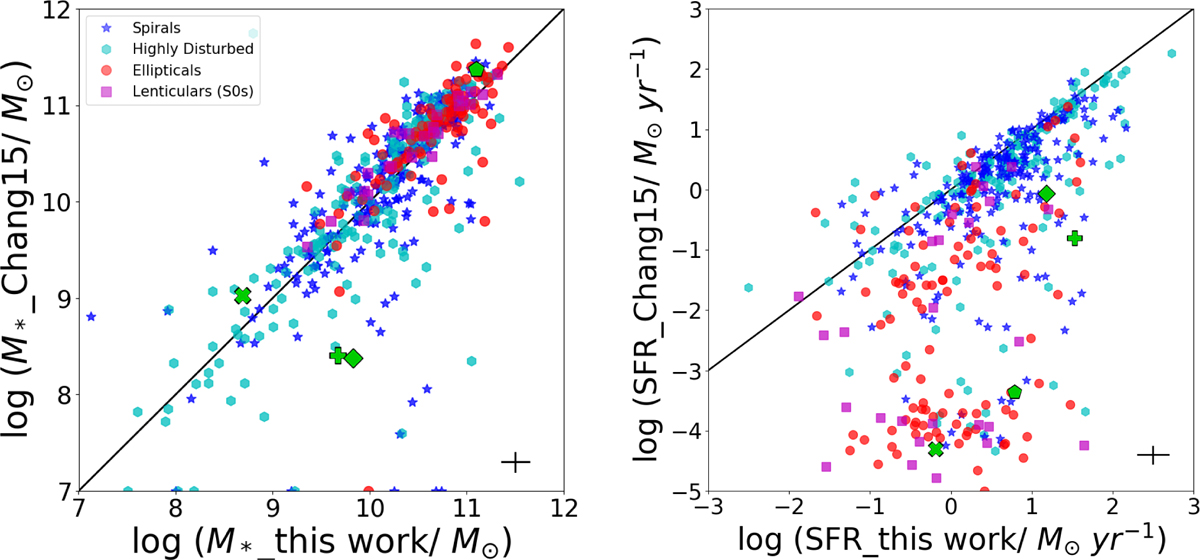
Comparison between our M* (left panel) and SFR (right panel) estimates to the estimates listed by CHANG 15. The typical error is shown in the bottom right corner of each main panel. Data points at the lowest y-axis values in the left panel represent galaxies with the minimum value set by CHANG 15. These data points are not considered for the fits. The merging galaxies are coloured by morphology as shown in the legend.
Current usage metrics show cumulative count of Article Views (full-text article views including HTML views, PDF and ePub downloads, according to the available data) and Abstracts Views on Vision4Press platform.
Data correspond to usage on the plateform after 2015. The current usage metrics is available 48-96 hours after online publication and is updated daily on week days.
Initial download of the metrics may take a while.