Open Access
Fig. 15
Download original image
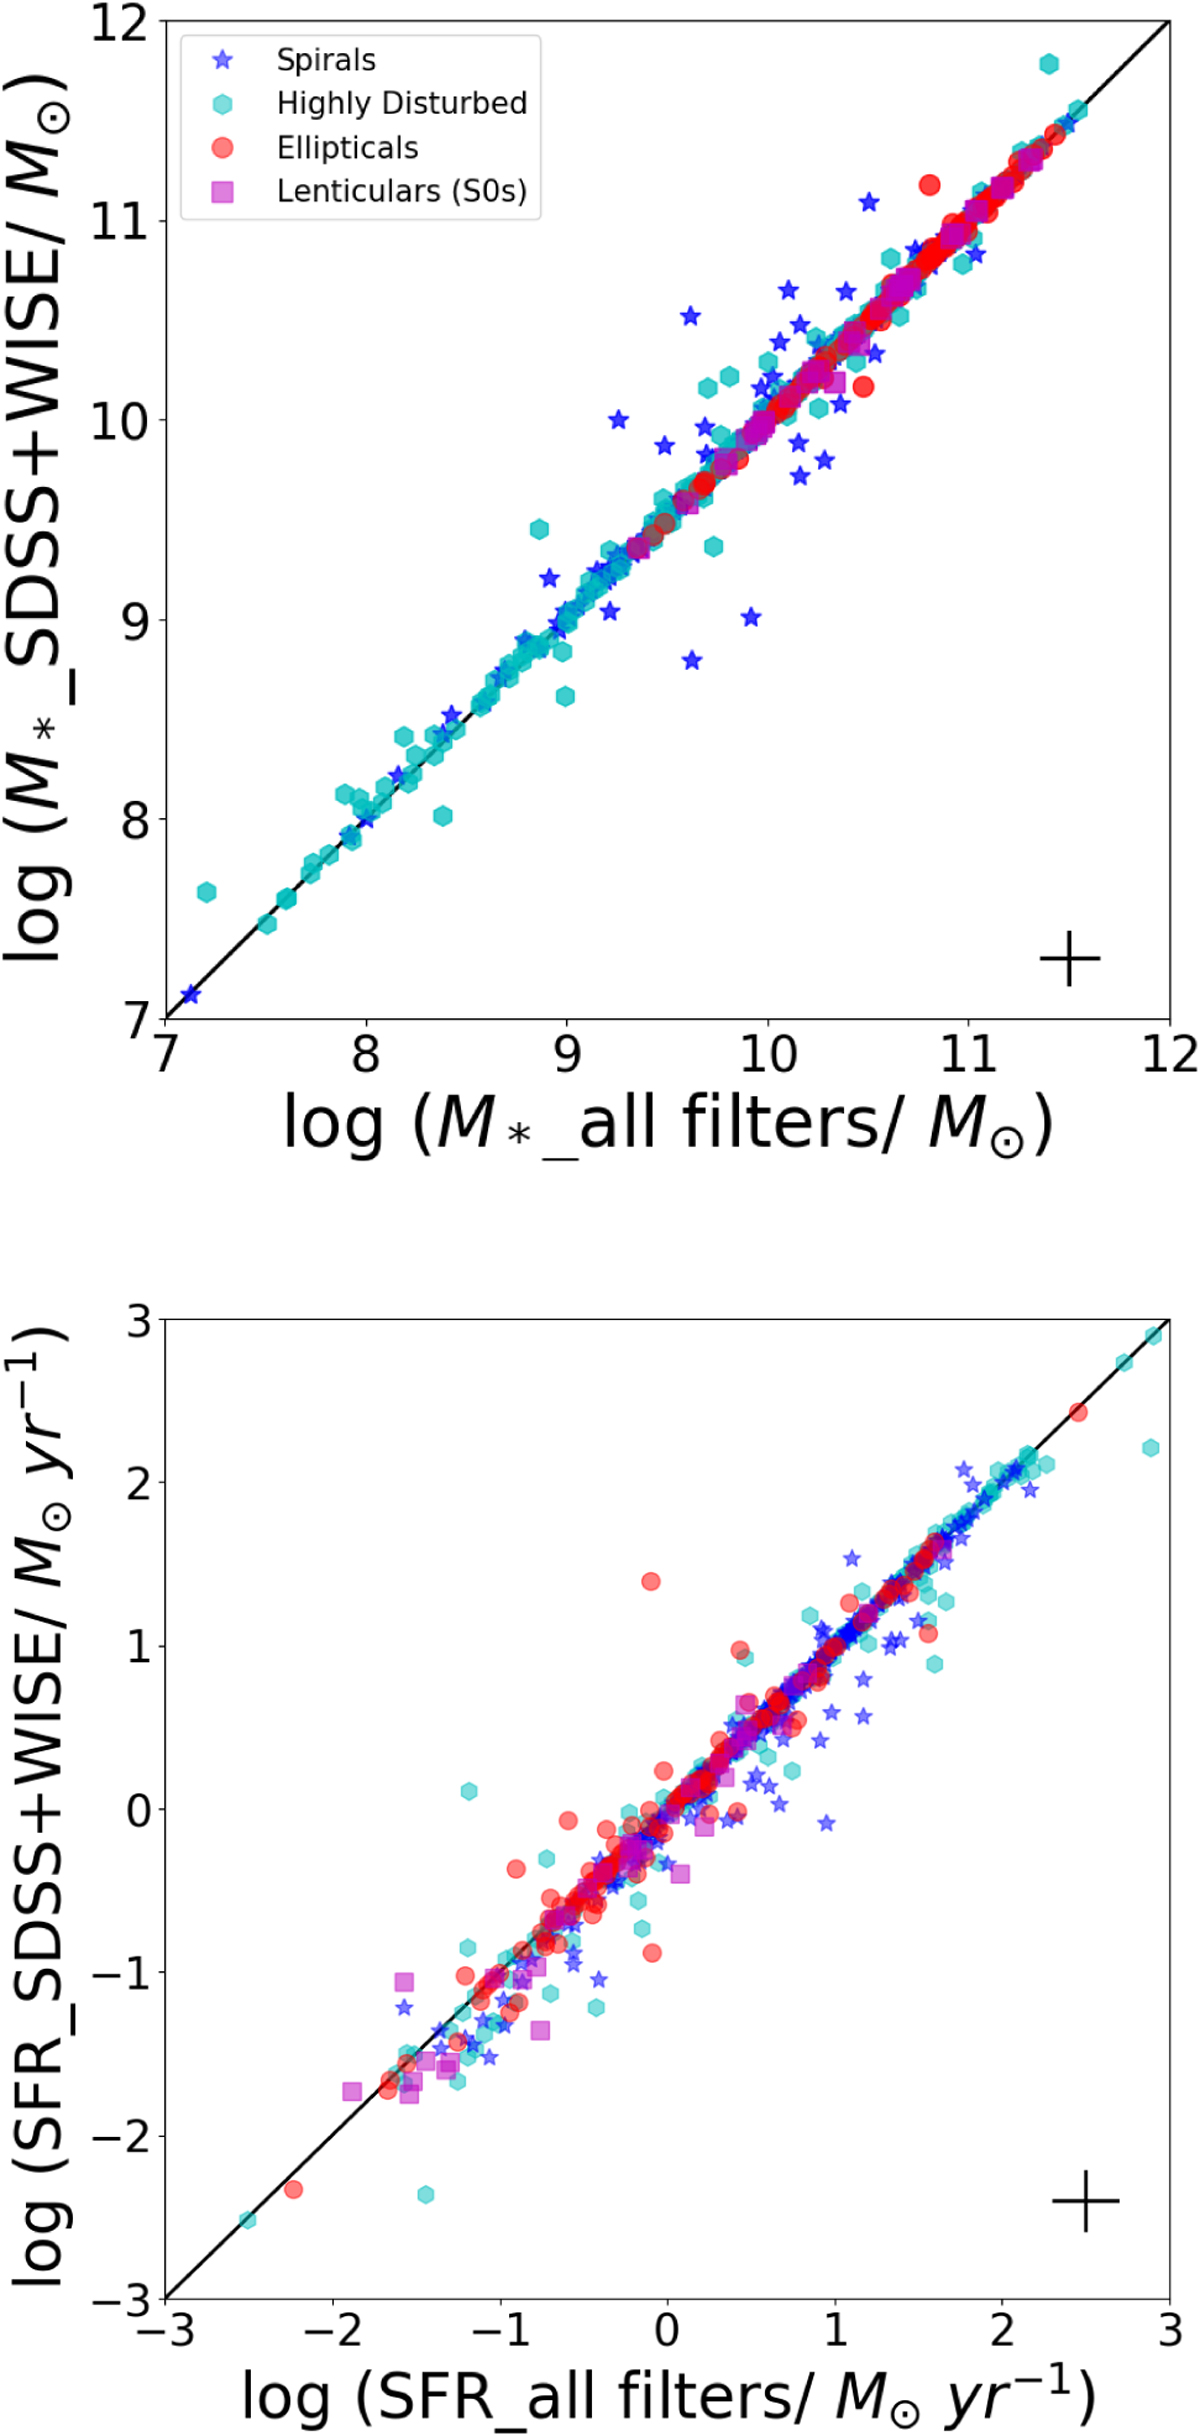
Comparison of the M* (top) and SFR (bottom) estimated by MAGPHYS when using all filters (see text) on the x-axis and only SDSS+WISE filters on the y-axis. The typical error is shown in the bottom right corner of each panel. The sample is colour-coded according to morphology as indicated in the legend.
Current usage metrics show cumulative count of Article Views (full-text article views including HTML views, PDF and ePub downloads, according to the available data) and Abstracts Views on Vision4Press platform.
Data correspond to usage on the plateform after 2015. The current usage metrics is available 48-96 hours after online publication and is updated daily on week days.
Initial download of the metrics may take a while.