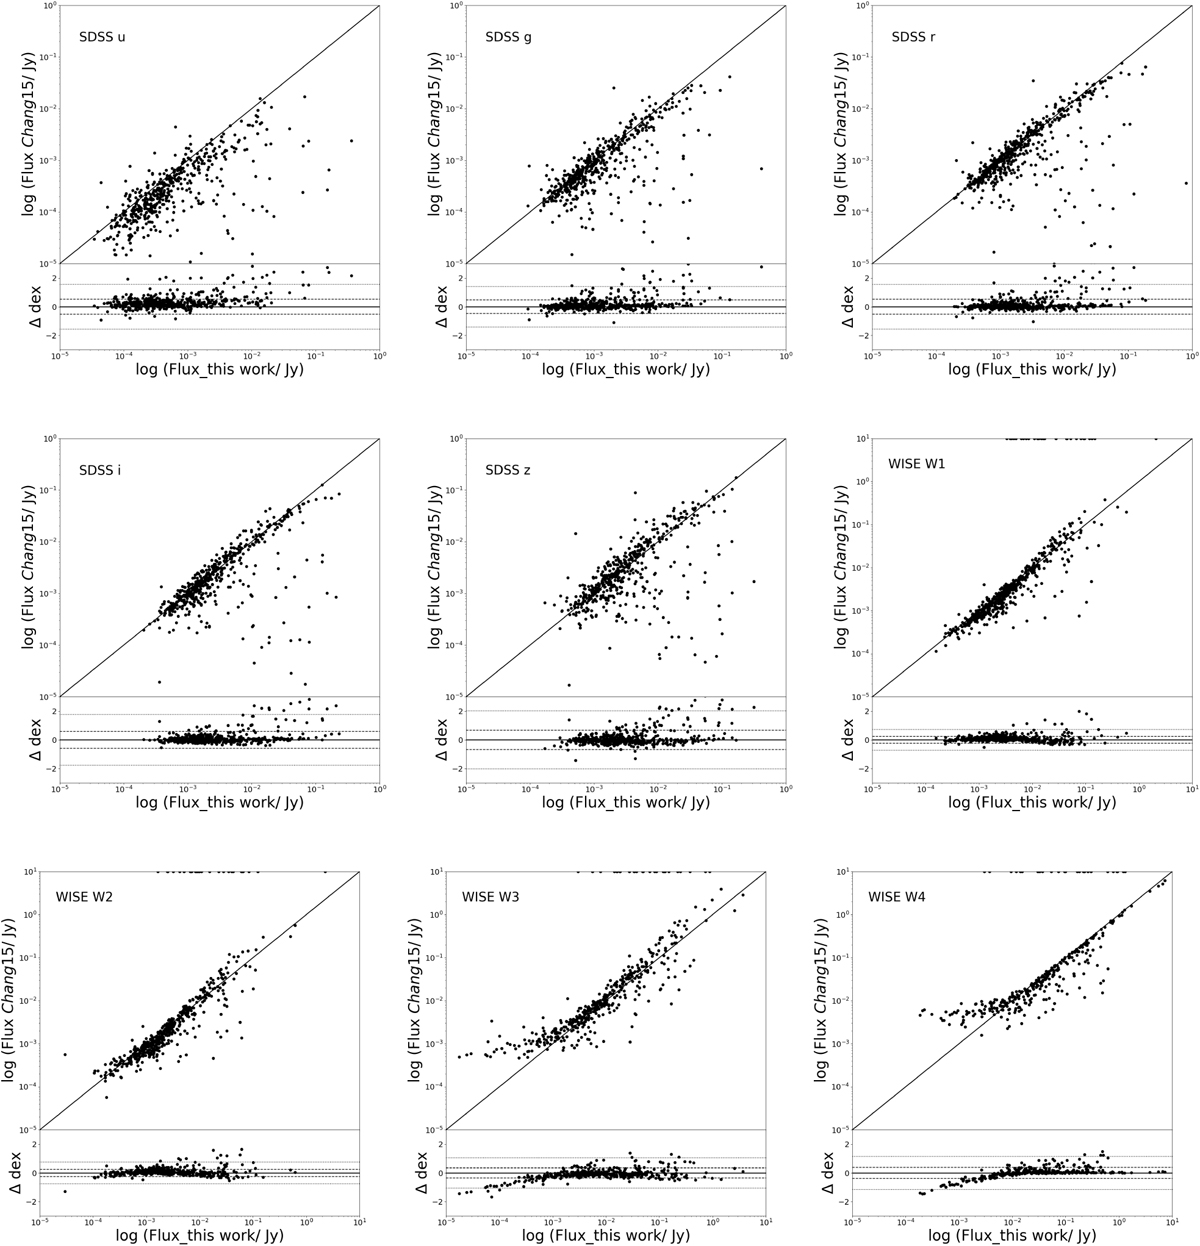
Fig. 11

Download original image
Comparison of our aperture flux values with those listed by CHANG 15 for all galaxies common to our samples. Specifically, we use the SDSS MODELFLUX values and the WISE mpro fluxes from CHANG 15. The solid line in each main panel shows the line of equality and each small panel shows the difference between the two axes. Data points at the highest y-axis values in each main panel represent galaxies with fluxes measured by us, but not by CHANG 15. The dashed and dotted lines show the 1- and 3-σ deviation from the one-to-one relation, respectively.
Current usage metrics show cumulative count of Article Views (full-text article views including HTML views, PDF and ePub downloads, according to the available data) and Abstracts Views on Vision4Press platform.
Data correspond to usage on the plateform after 2015. The current usage metrics is available 48-96 hours after online publication and is updated daily on week days.
Initial download of the metrics may take a while.


