Fig. 5.
Download original image
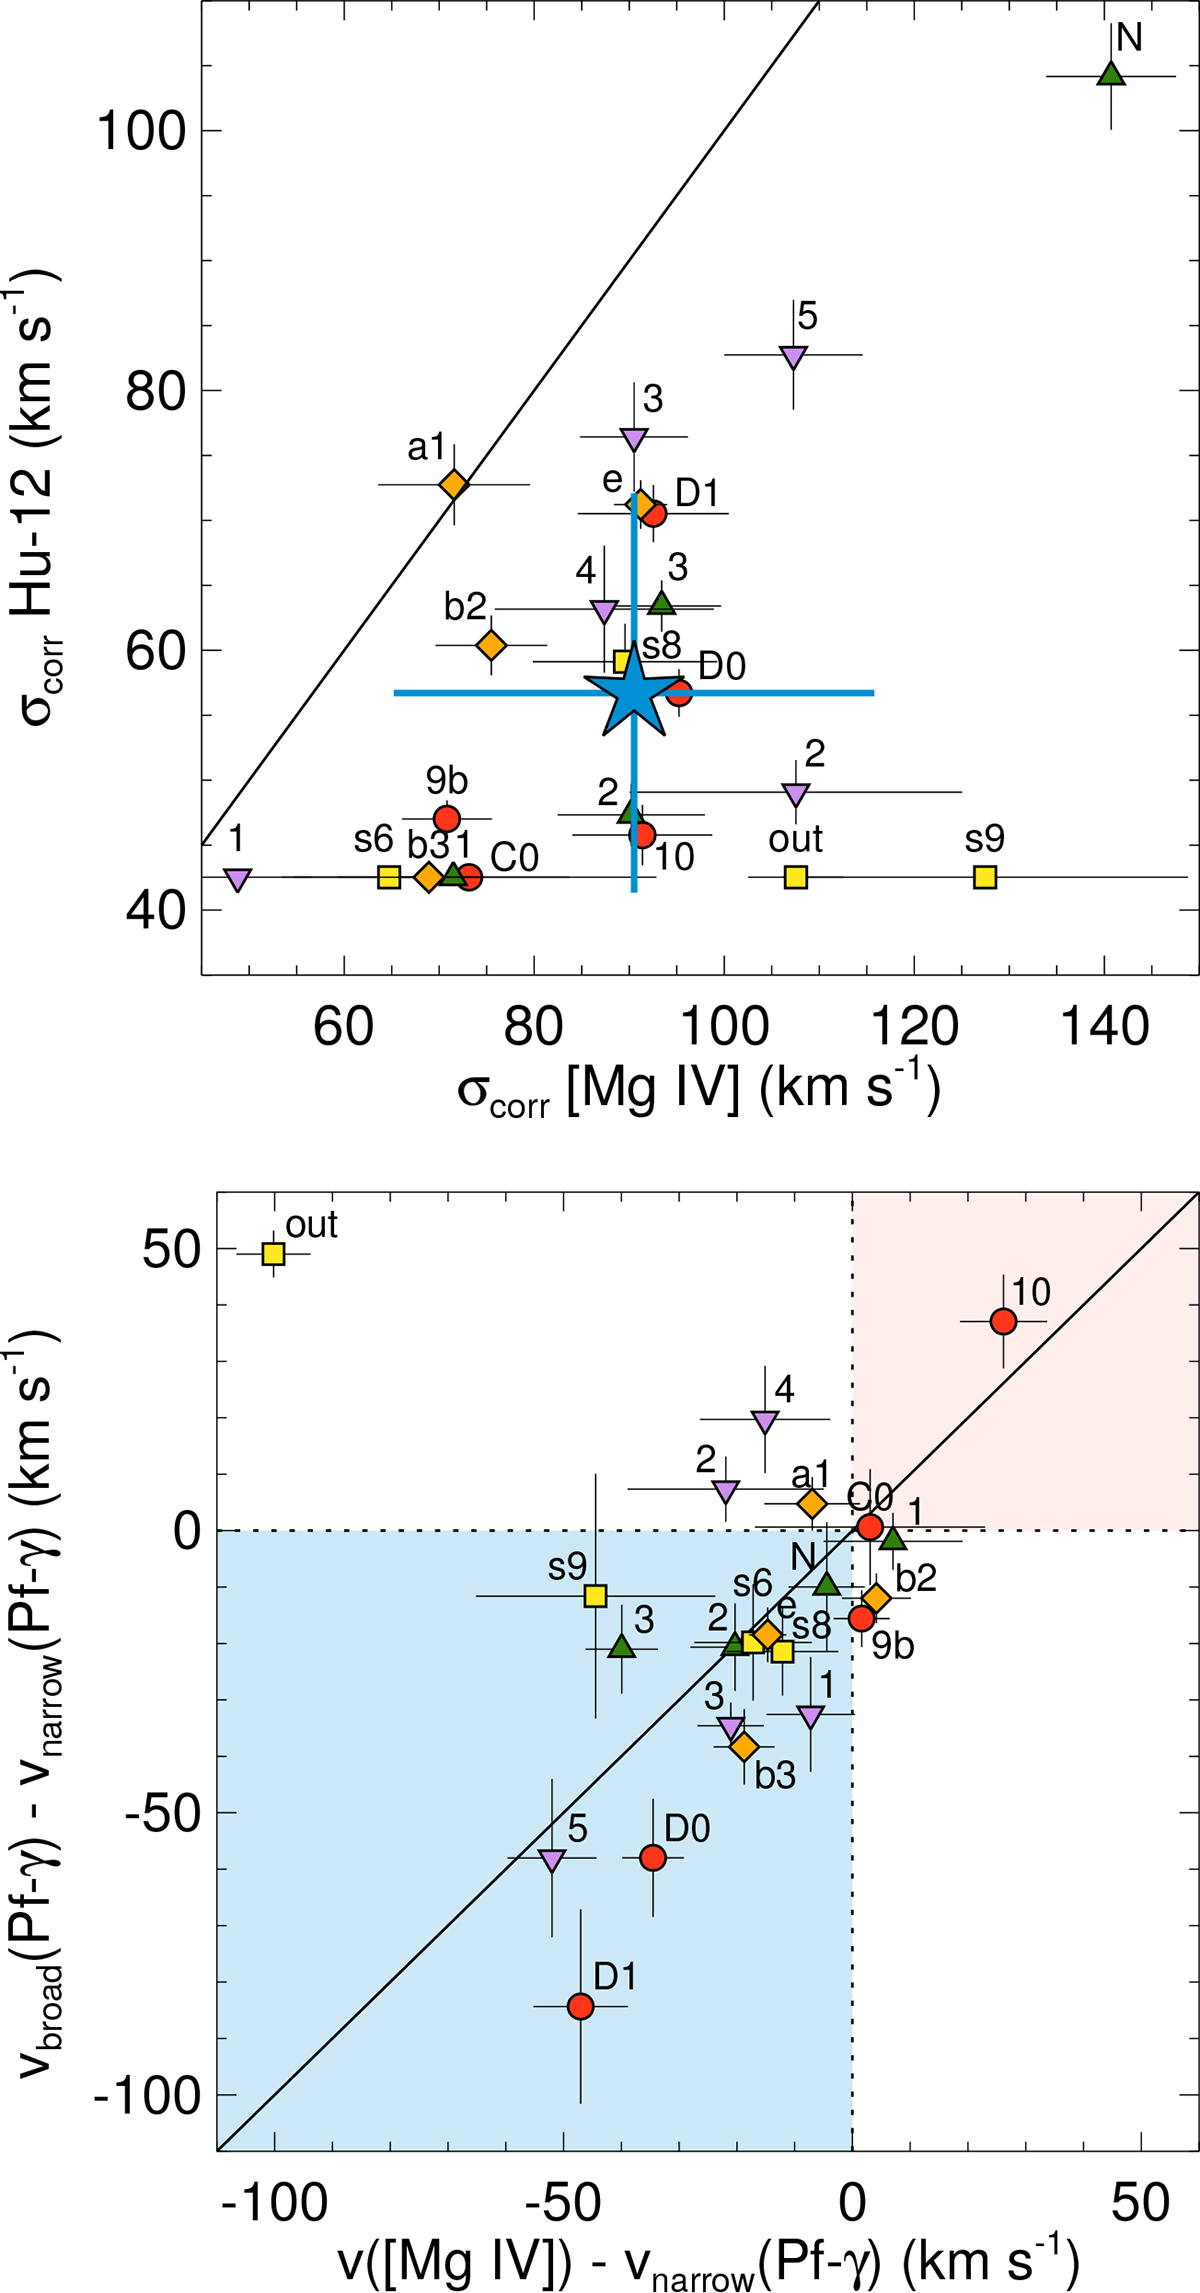
Comparison between the width, corrected for the instrumental resolution, of the [Mg IV] and Hu-12 lines (top) and between the velocity shifts of [Mg IV] and the broad Pf-γ component relative to the narrow Pf-γ component (bottom). The symbols are as in Fig. 3. The large blue star in the top panel represents the mean σcorr in each axis. The solid black line is the one-to-one relation. The shaded blue and red areas in the bottom panel indicate blue and red velocity shifts, respectively.
Current usage metrics show cumulative count of Article Views (full-text article views including HTML views, PDF and ePub downloads, according to the available data) and Abstracts Views on Vision4Press platform.
Data correspond to usage on the plateform after 2015. The current usage metrics is available 48-96 hours after online publication and is updated daily on week days.
Initial download of the metrics may take a while.