Fig. 4.
Download original image
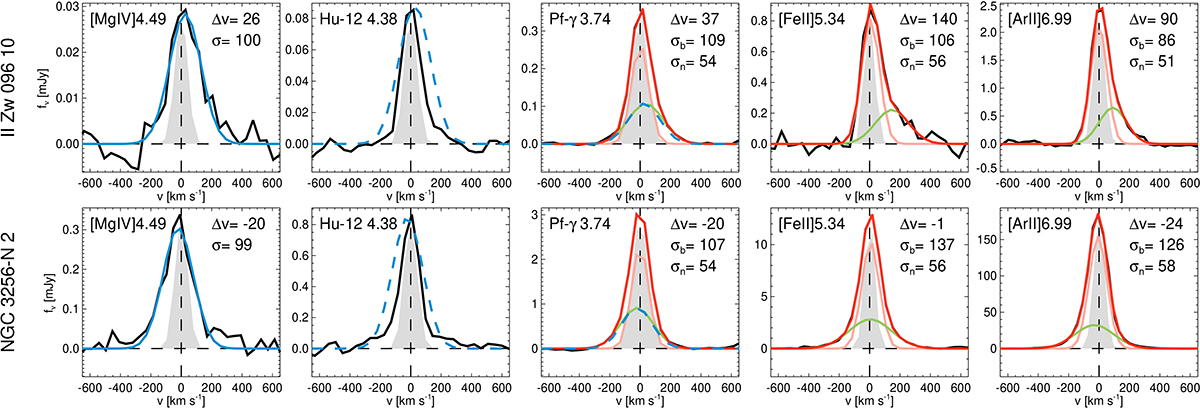
Observed profiles of the [Mg IV], Hu-12, Pf-γ, [Fe II], and [Ar II] emission lines (solid black line) for two selected regions. The remaining regions are shown in Fig. B.1. The filled gray Gaussian represents the instrumental spectral resolution. The blue line in the first panel is the best single Gaussian fit to the [Mg IV] profile. The [Mg IV] model is also plotted as a blue dashed line in the second and third panels, normalized to the peak of Hu-12 and the broad Pf-γ component, respectively, for reference. The two component fits for Pf-γ, [Fe II], and [Ar II], are represented by the pink (narrow component) and green (broad component) lines and the total model in red. For reference, the dashed lines indicate the rest velocity for each region derived from the narrow component of Pf-γ and the zero flux level. The observed (not corrected for instrumental resolution) σ and velocity shift derived from the Gaussian fits are indicated in each panel in km s−1.
Current usage metrics show cumulative count of Article Views (full-text article views including HTML views, PDF and ePub downloads, according to the available data) and Abstracts Views on Vision4Press platform.
Data correspond to usage on the plateform after 2015. The current usage metrics is available 48-96 hours after online publication and is updated daily on week days.
Initial download of the metrics may take a while.