Fig. 3.
Download original image
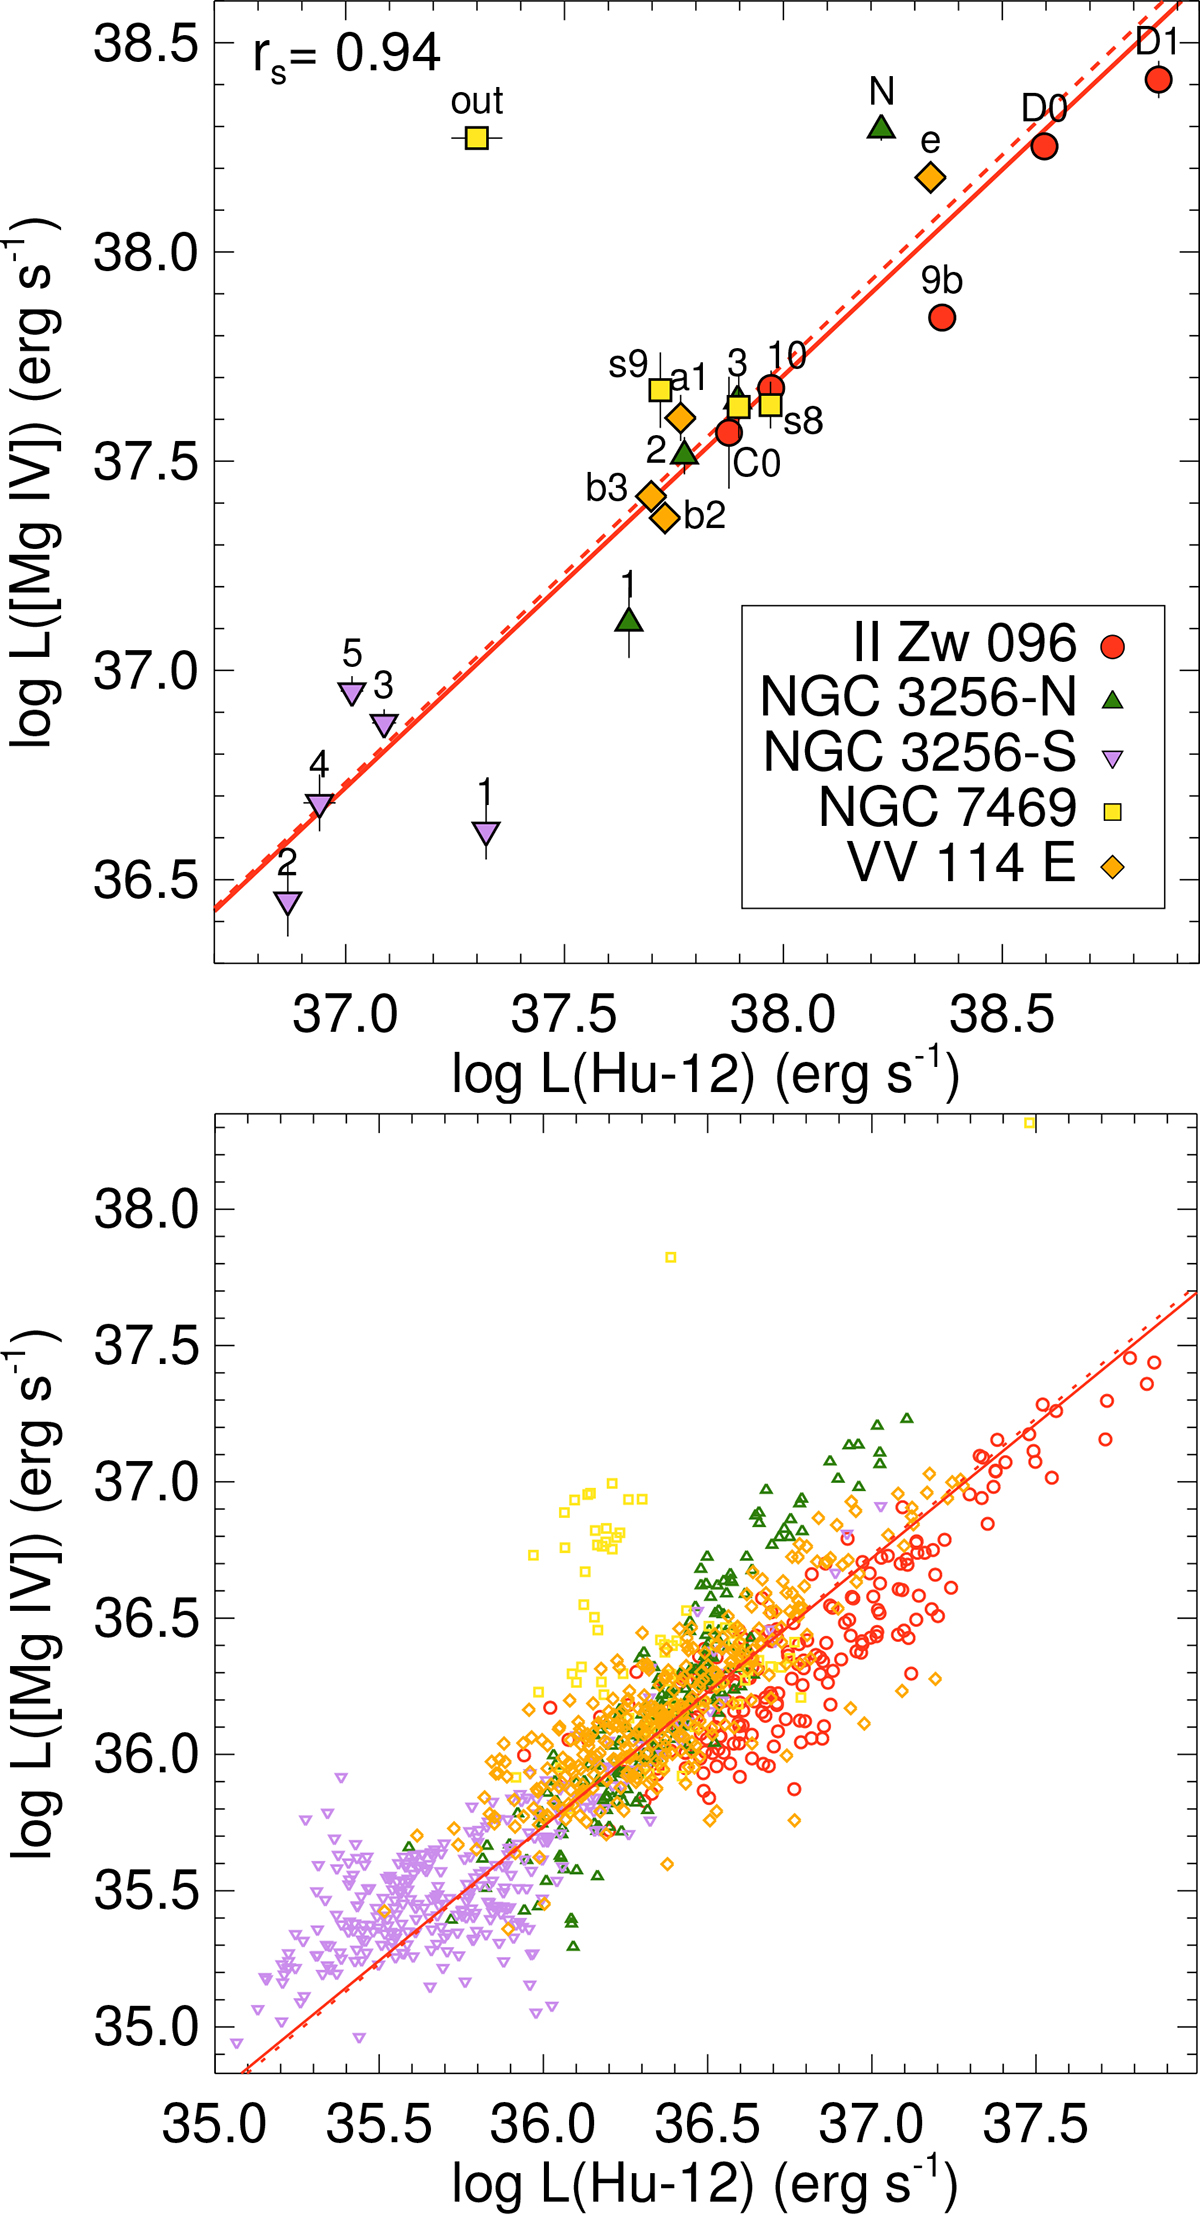
[Mg IV] vs. Hu-12 luminosities of the selected regions (top) and for every spaxel (bottom). Different colors and symbols are used to identify the regions of each object. In the top panel, the labels of the points are the names of the regions. The Spearman correlation coefficient, rs, is indicated. The solid and dashed red lines are the best fit (log y = 0.30 + 0.98log x) and best linear fit (log y = ( − 0.29 ± 0.18)+log x), respectively, to the luminosities of the regions.
Current usage metrics show cumulative count of Article Views (full-text article views including HTML views, PDF and ePub downloads, according to the available data) and Abstracts Views on Vision4Press platform.
Data correspond to usage on the plateform after 2015. The current usage metrics is available 48-96 hours after online publication and is updated daily on week days.
Initial download of the metrics may take a while.