Fig. 2.
Download original image
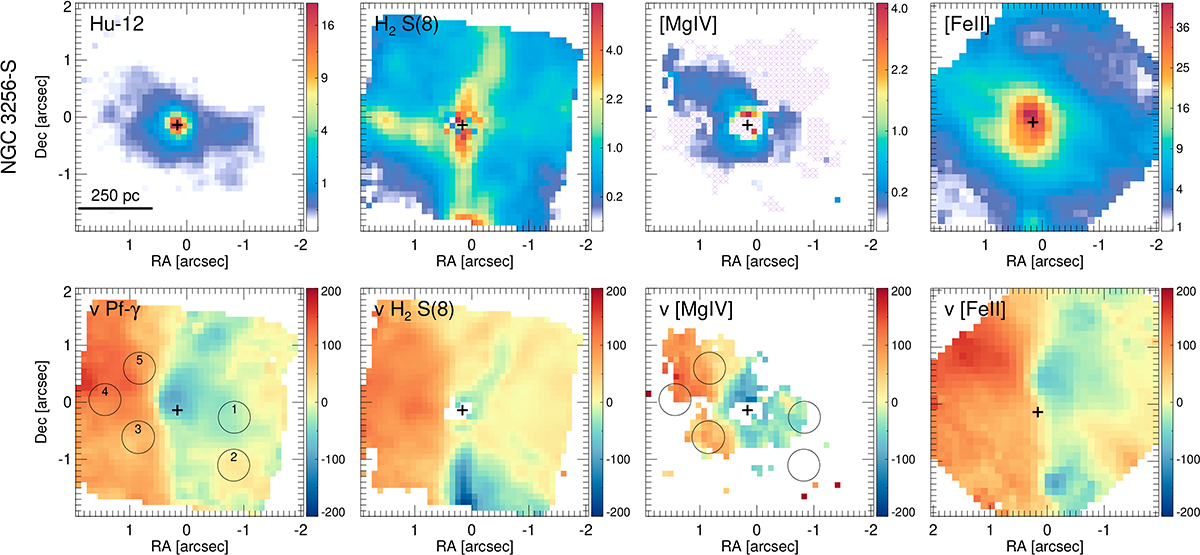
Line maps and velocity fields for NGC 3256 S. The remaining objects are in Figs. A.1–A.4. Top row from left to right: Line maps of Hu-12, H2 S(8), [Mg IV], and [Fe II]. The areas filled with purple crosses in the [Mg IV] panel correspond to regions where the CO v = 1–0 band is strong and complicates the modeling of the [Mg IV] line. The black cross indicates the position of the nucleus. Bottom row from left to right: Velocity fields from single Gaussian fits of Pf-γ, H2 S(8), [Mg IV], and [Fe II]. The circles in the first and third panel give the location and size of the selected regions. The units of the color scale are 10−15 erg cm−2 s−1 arcsec−1 for the line maps and km s−1 for the velocity fields.
Current usage metrics show cumulative count of Article Views (full-text article views including HTML views, PDF and ePub downloads, according to the available data) and Abstracts Views on Vision4Press platform.
Data correspond to usage on the plateform after 2015. The current usage metrics is available 48-96 hours after online publication and is updated daily on week days.
Initial download of the metrics may take a while.