Fig. 8.
Download original image
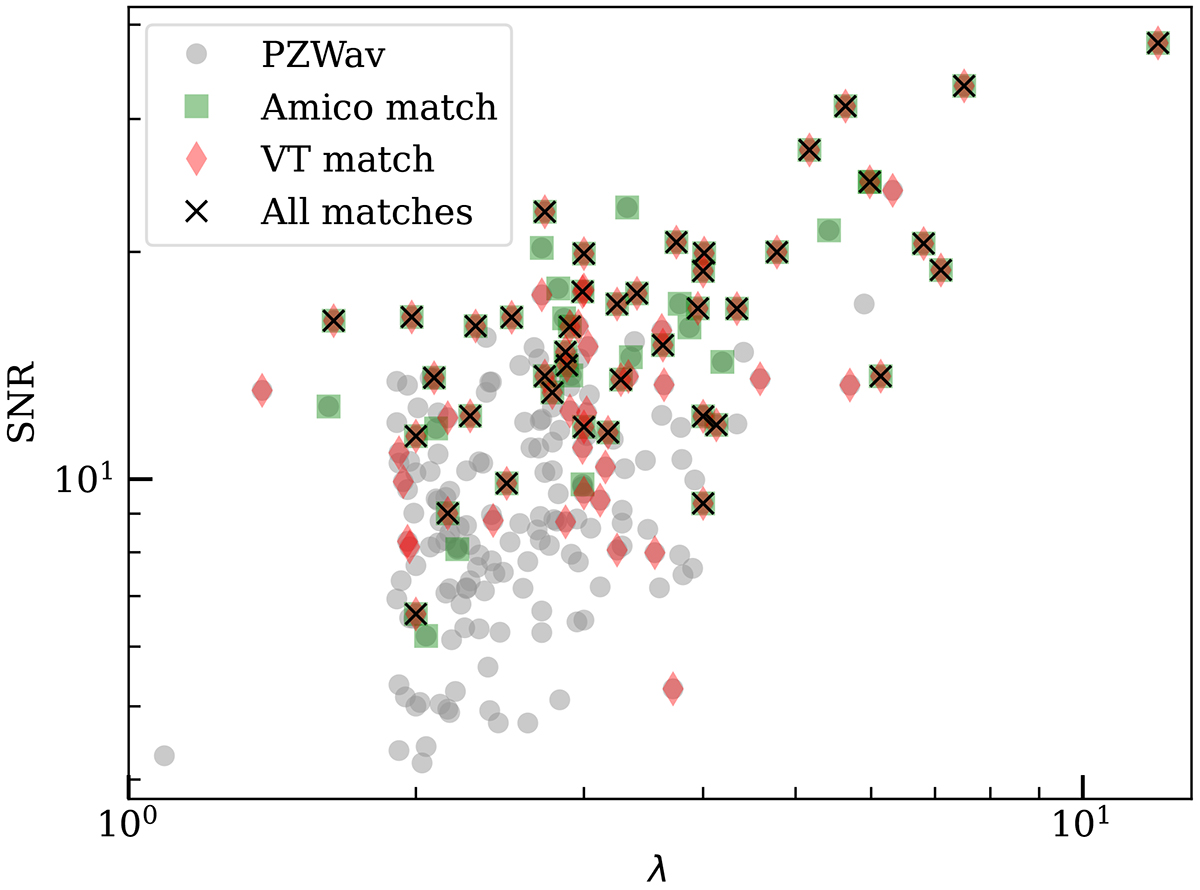
Richness distribution in function of the S/N for the optical catalogues. PZWav is shown with grey dots, PZWav matches to VT are in red, and PZWav matches to the AMICO catalogue are in green. The matches between the three catalogues are indicated with x’s. The apparent wall at λ = 1.9 is produced by the richness cut described in Sect. 4.4. Lower λ values are from structures with z < 0.3, which are affected by another richness threshold.
Current usage metrics show cumulative count of Article Views (full-text article views including HTML views, PDF and ePub downloads, according to the available data) and Abstracts Views on Vision4Press platform.
Data correspond to usage on the plateform after 2015. The current usage metrics is available 48-96 hours after online publication and is updated daily on week days.
Initial download of the metrics may take a while.