Open Access
Fig. 5.
Download original image
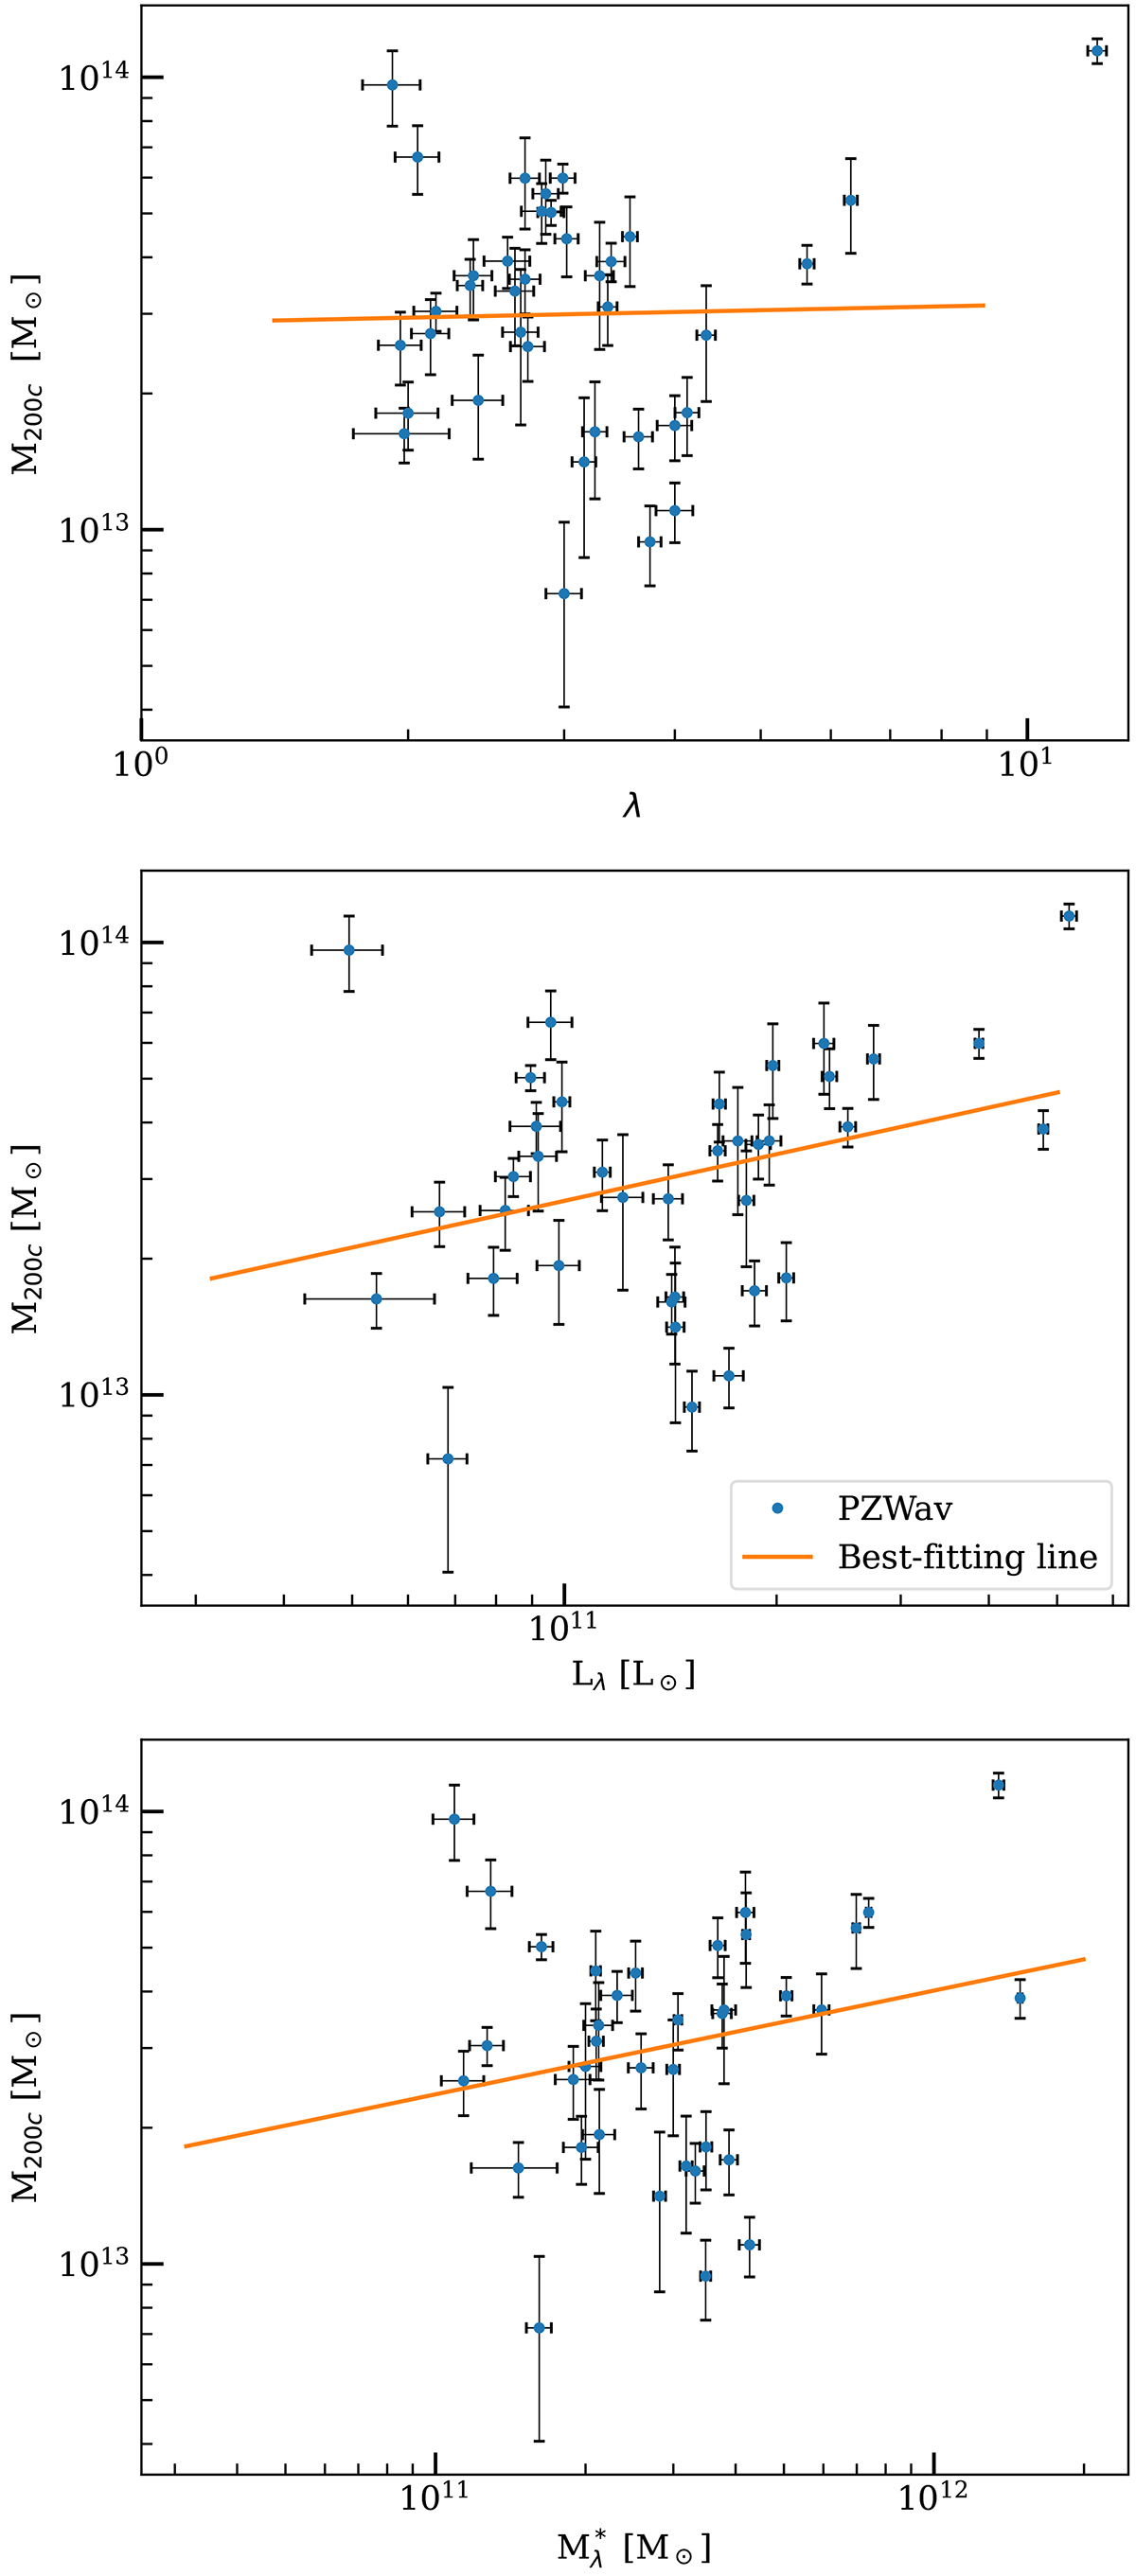
Results obtained with the linear regression. Top panel: M200c estimated from the X-ray luminosity and richness. Middle panel: M200c versus optical luminosity, Lλ. Bottom panel: M200c versus stellar mass, ![]() . The orange lines represent the best-fitting values. Parameters can be found in Table 3.
. The orange lines represent the best-fitting values. Parameters can be found in Table 3.
Current usage metrics show cumulative count of Article Views (full-text article views including HTML views, PDF and ePub downloads, according to the available data) and Abstracts Views on Vision4Press platform.
Data correspond to usage on the plateform after 2015. The current usage metrics is available 48-96 hours after online publication and is updated daily on week days.
Initial download of the metrics may take a while.