Open Access
Fig. 3.
Download original image
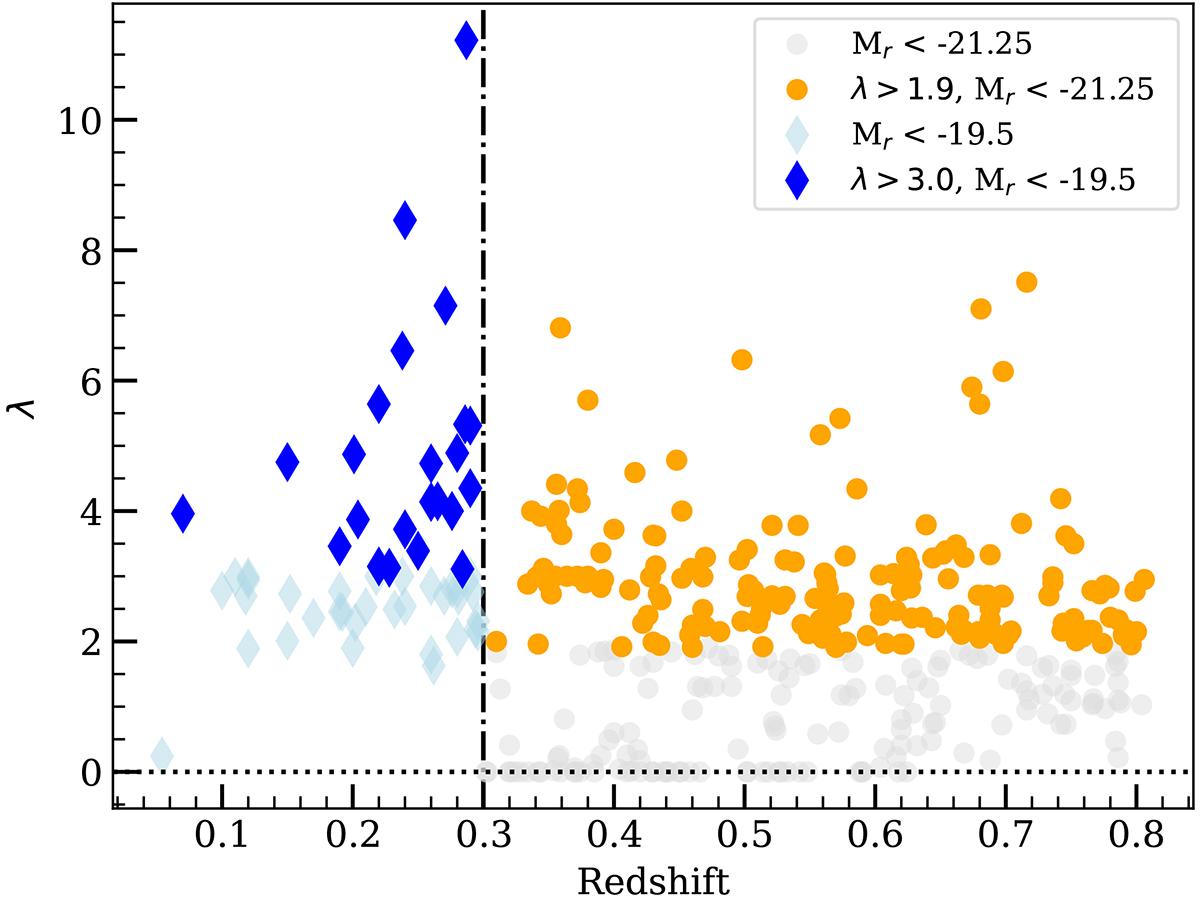
Richness distribution of the cluster candidates detected by PZWav for both group (blue) and cluster regimes (orange) – before (lighter) and after (darker colours) the richness threshold. The dashed line indicates the redshift transition at z = 0.3, and the dotted one as the λ = 0.
Current usage metrics show cumulative count of Article Views (full-text article views including HTML views, PDF and ePub downloads, according to the available data) and Abstracts Views on Vision4Press platform.
Data correspond to usage on the plateform after 2015. The current usage metrics is available 48-96 hours after online publication and is updated daily on week days.
Initial download of the metrics may take a while.