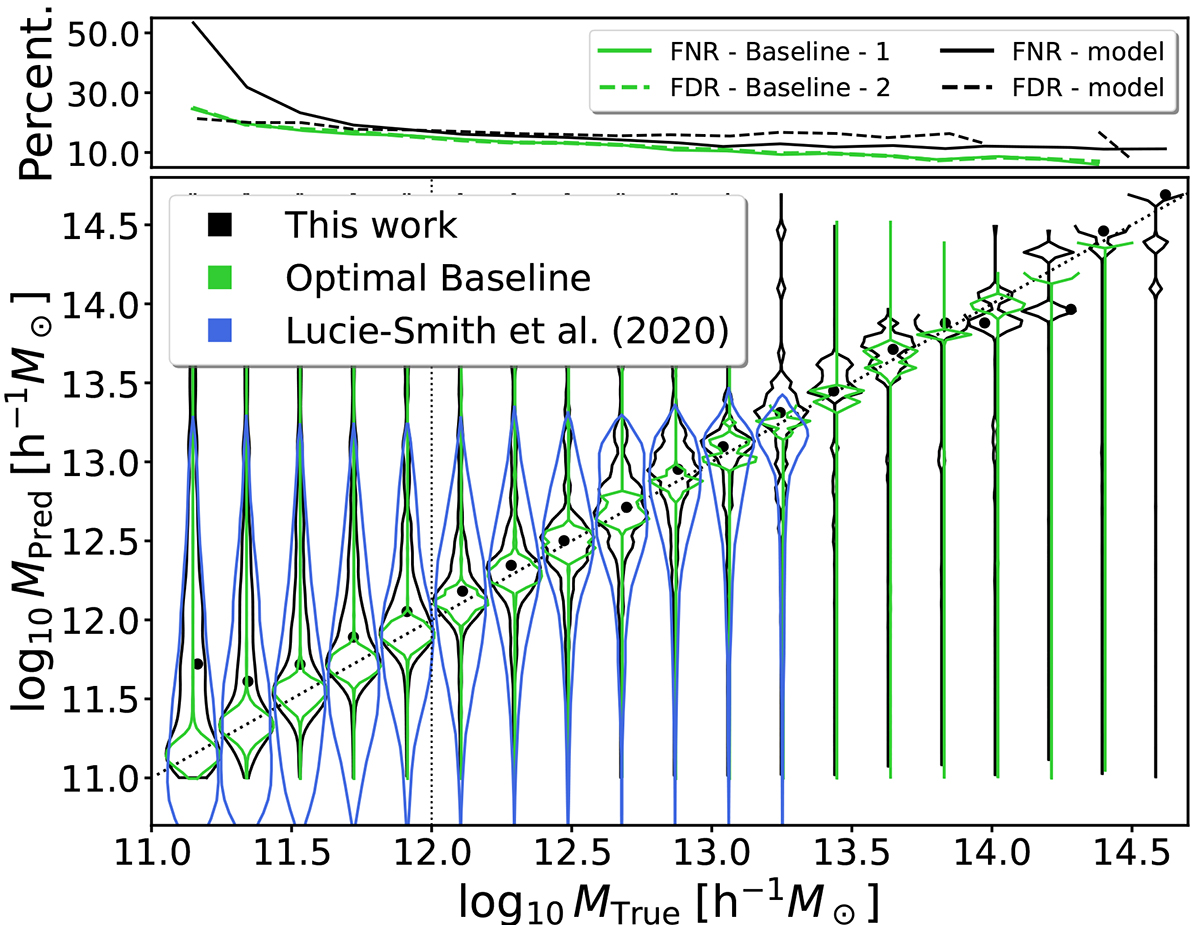
Fig. 8.
Download original image
“Violin plot”, visualizing the distribution of predicted halo masses (at a voxel level) for different ground-truth mass bins. The black violin plots show the results obtained with our instance segmentation model. Green violin plots show the agreement between the two baseline simulations – representing an optimal target accuracy. The blue violin plots in the main panel show the results presented in Lucie-Smith et al. (2024). The solid black line in the top panel shows the false negative rate, FNR, as a function of the ground truth halo mass. The dashed black line represents the fraction of predicted collapsed pixels that are not actually collapsed as a function of predicted halo mass (false discovery rate, FDR). The green lines on the top panel correspond to the analogous results obtained from the baseline simulations. The model predicts haloes accurately object-by-object for masses M ≳ 1012 h−1 M⊙.
Current usage metrics show cumulative count of Article Views (full-text article views including HTML views, PDF and ePub downloads, according to the available data) and Abstracts Views on Vision4Press platform.
Data correspond to usage on the plateform after 2015. The current usage metrics is available 48-96 hours after online publication and is updated daily on week days.
Initial download of the metrics may take a while.