Fig. 1.
Download original image
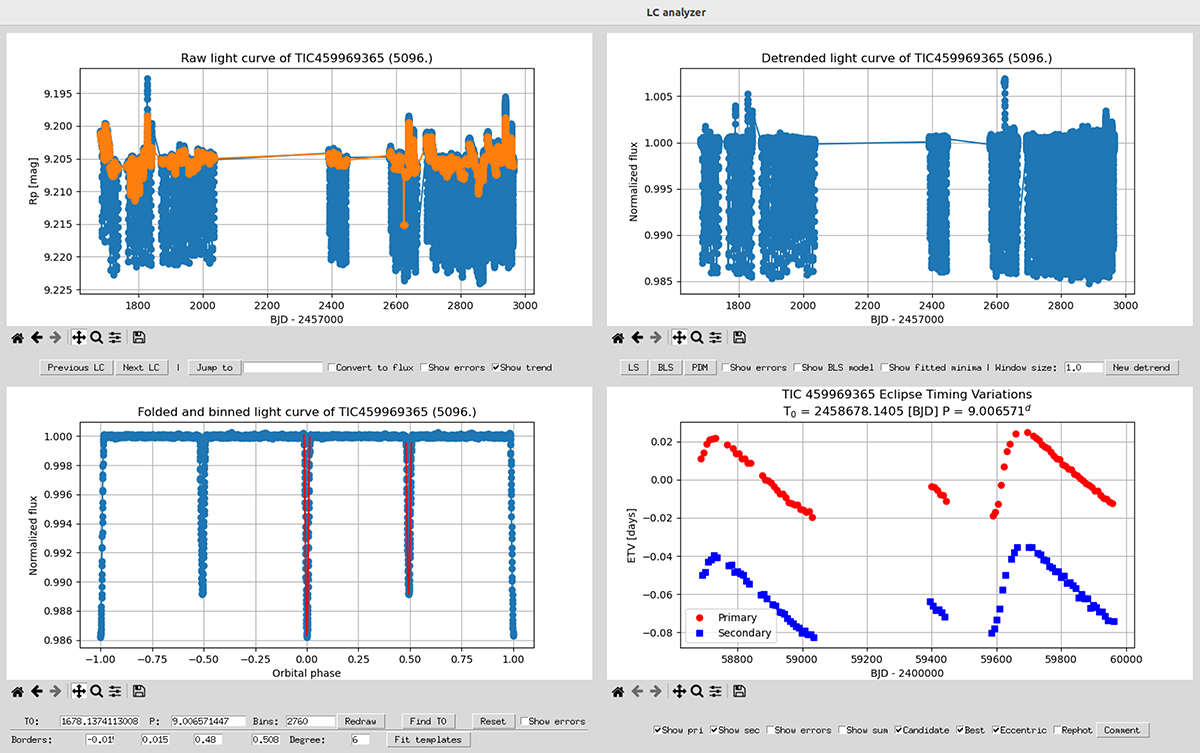
Current look of our self-developed unique light- and ETV-curve analyzer GUI. In the top left corner, the raw light curve is plotted (blue) alongside the fitted trends (orange). In the top right corner, the detrended light curve is plotted after the normalization by the previously fitted trends. In the lower left corner, the previously detrended and normalized light curve binned and folded with the specified bin numbers and ephemeris is plotted alongside the polinomial templates fitted on the two types of eclipses. Finally, in the lower right corner, the ETVs calculated from the primary (red) and secondary (blue) mid-eclipse times using the indicated ephemeris from the top are plotted. Below each panel are several useful features (see the text for details) that enable a fast interactive analysis of any set of light curves.
Current usage metrics show cumulative count of Article Views (full-text article views including HTML views, PDF and ePub downloads, according to the available data) and Abstracts Views on Vision4Press platform.
Data correspond to usage on the plateform after 2015. The current usage metrics is available 48-96 hours after online publication and is updated daily on week days.
Initial download of the metrics may take a while.