Fig. 4.
Download original image
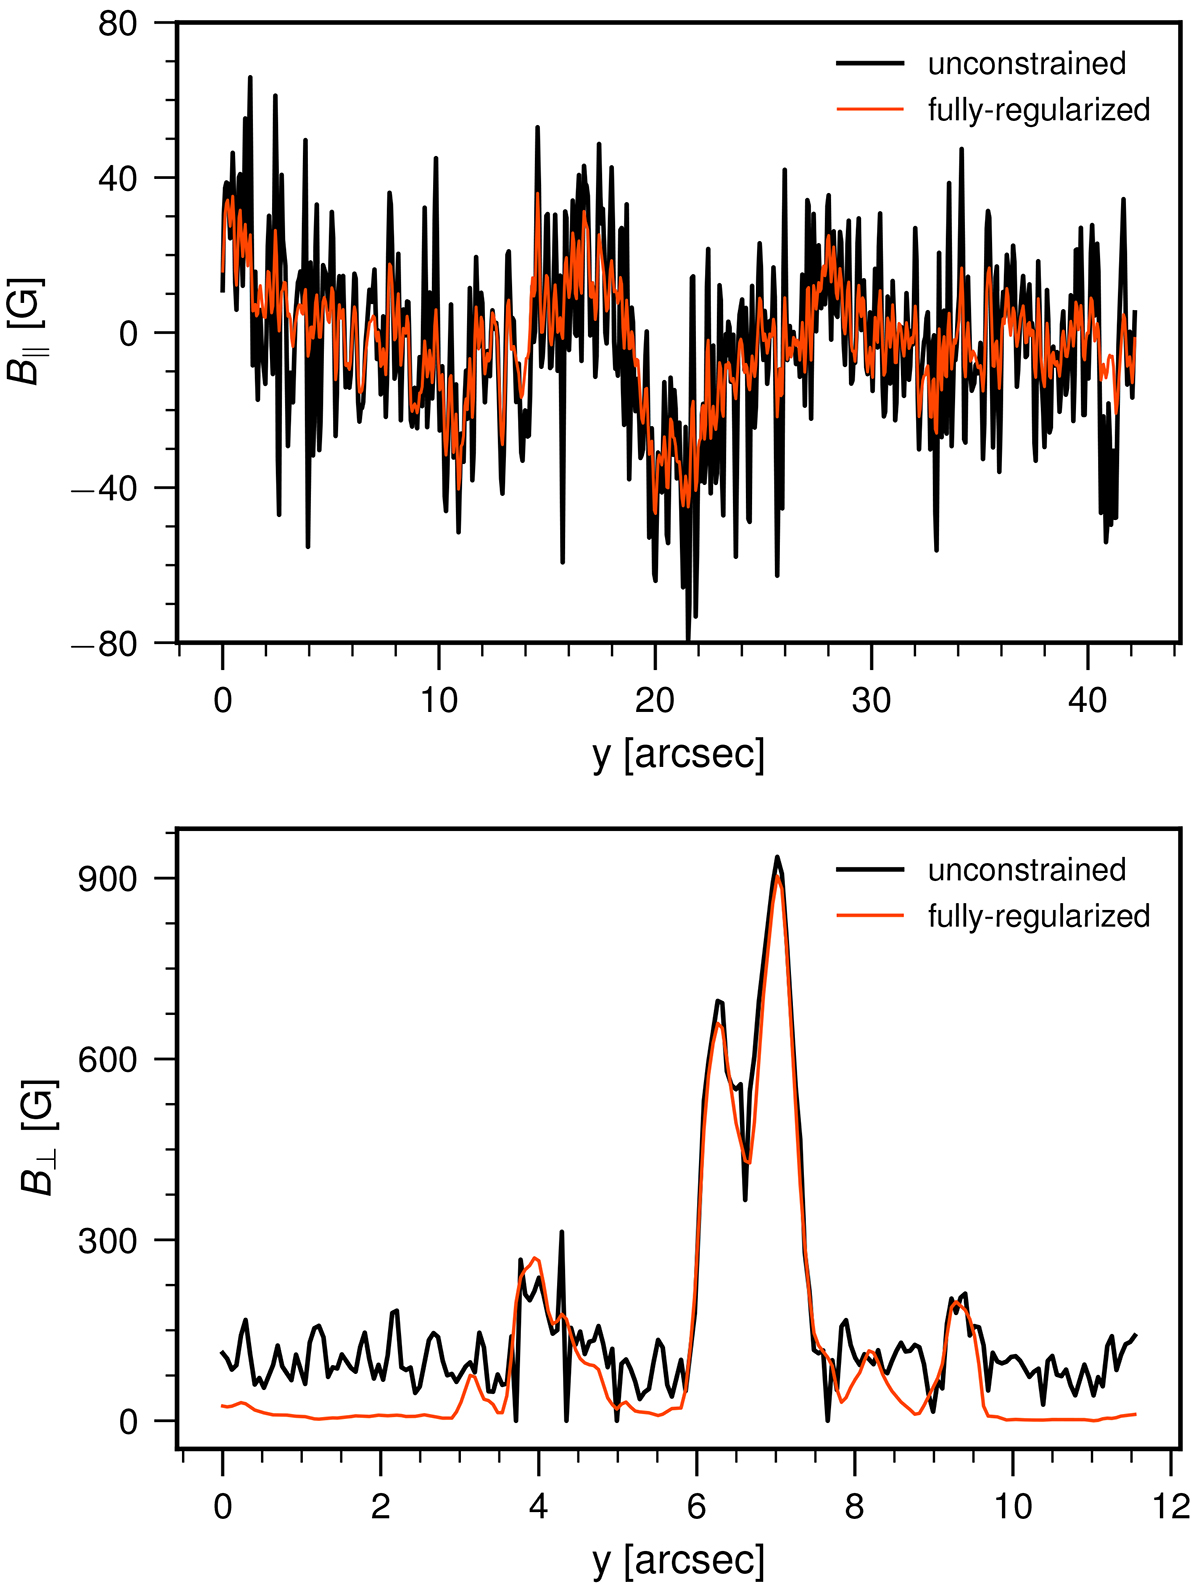
Vertical cuts of the reconstructed magnetic field. The upper panel shows a reconstruction of B∥ with the weak-field approximation from the 854.2 nm dataset along a cut indicated with red markers in Fig. 3. The black curve shows the unconstrained reconstruction, and the red curve shows the reconstruction with both spatial and temporal regularisation. A similar plot is shown in the lower panel for the reconstruction of B⊥ from the ME inversion of the 617.3 nm dataset presented in Fig. 7.
Current usage metrics show cumulative count of Article Views (full-text article views including HTML views, PDF and ePub downloads, according to the available data) and Abstracts Views on Vision4Press platform.
Data correspond to usage on the plateform after 2015. The current usage metrics is available 48-96 hours after online publication and is updated daily on week days.
Initial download of the metrics may take a while.