Fig. 7
Download original image
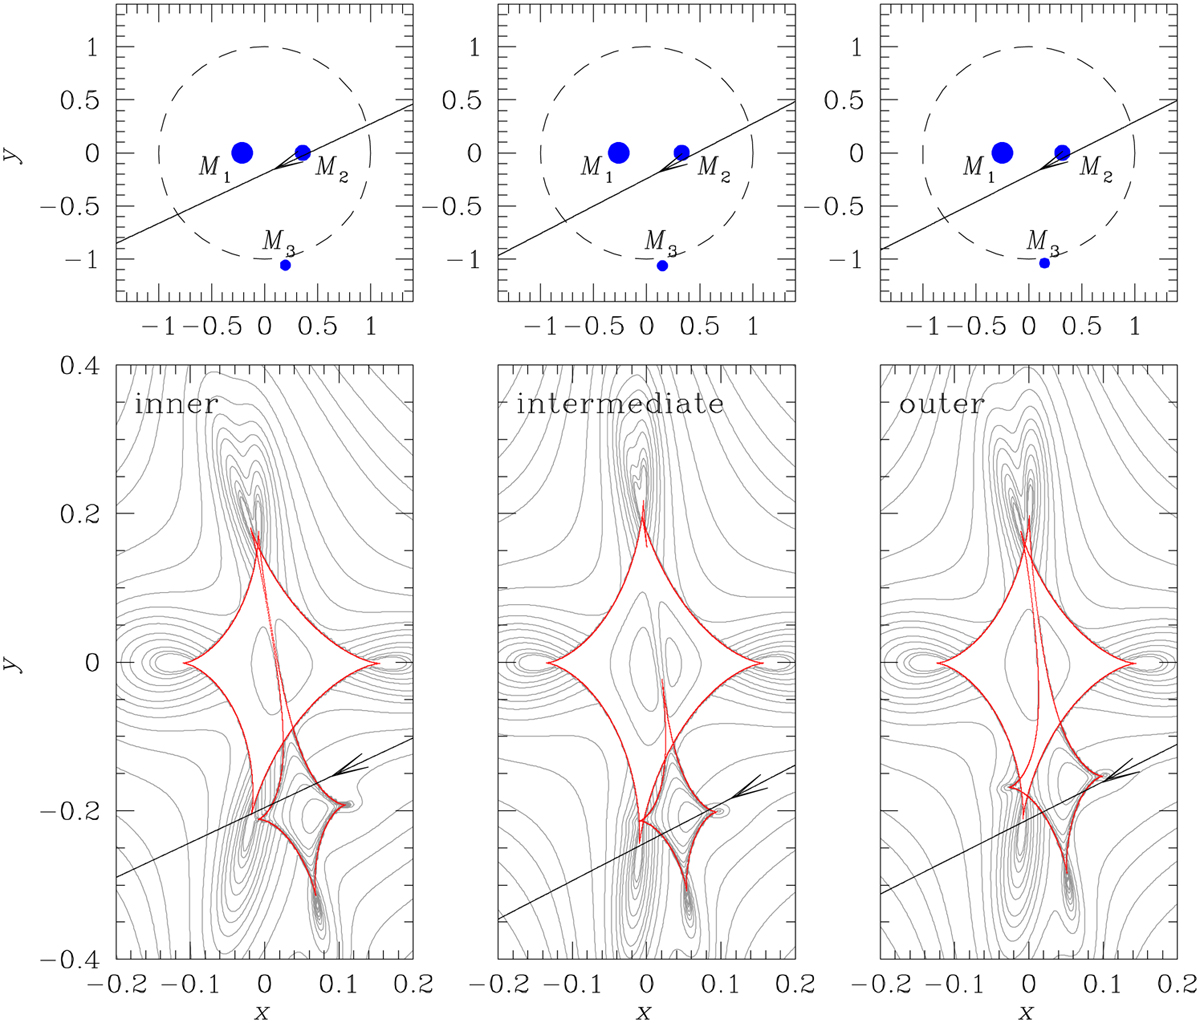
Lens-system configurations of the three degenerate 3L1S solutions. For each solution, the lower panel shows the source trajectory, marked by an arrowed line, with respect to the caustic, and the upper panel shows the trajectory with respect to the positions of the lens components, marked by blue dots with labels M1, M1, and M3. The gray curves encompassing the caustic in the lower panels represent equi-magnification contours. The dashed circles in the upper panels represent the Einstein ring.
Current usage metrics show cumulative count of Article Views (full-text article views including HTML views, PDF and ePub downloads, according to the available data) and Abstracts Views on Vision4Press platform.
Data correspond to usage on the plateform after 2015. The current usage metrics is available 48-96 hours after online publication and is updated daily on week days.
Initial download of the metrics may take a while.