Fig. 4
Download original image
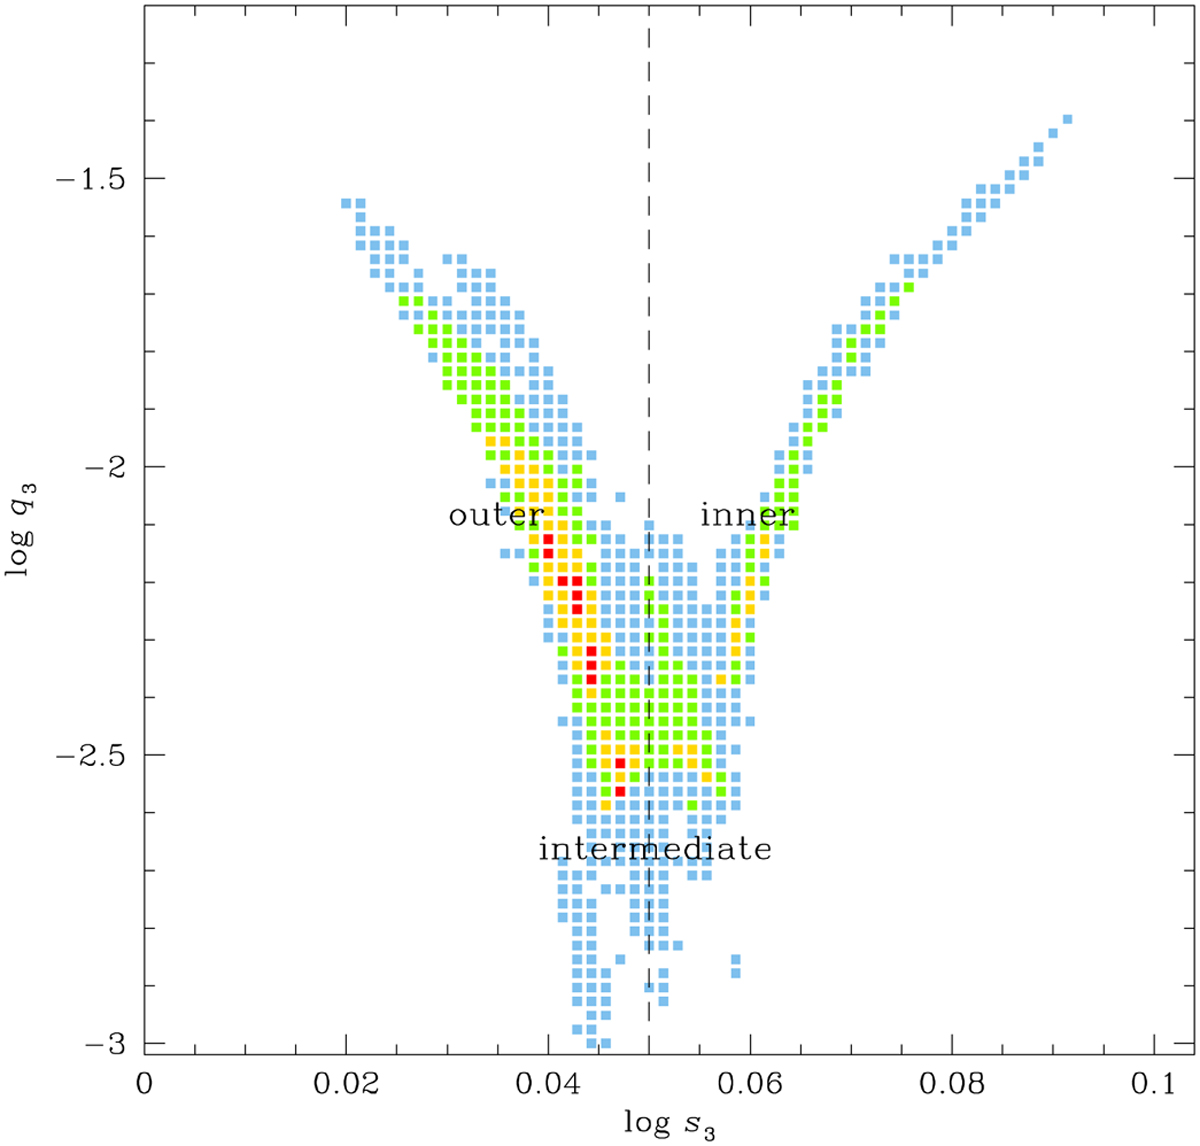
∆χ2 map on the (log s3, log q3) parameter plane. The color-coding is configured to correspond to data points based on their ∆χ2 values: red for ∆χ2 ≤ 12n, yellow for ≤ 22n, green for ≤ 32n, and cyan for ≤ 42n, where n = 4. The three distinct local solutions are marked as inner, intermediate, and outer. The dashed vertical line represents the geometric mean (s3,in × s3,out)1/2 of the planetary separations for the inner and outer solutions.
Current usage metrics show cumulative count of Article Views (full-text article views including HTML views, PDF and ePub downloads, according to the available data) and Abstracts Views on Vision4Press platform.
Data correspond to usage on the plateform after 2015. The current usage metrics is available 48-96 hours after online publication and is updated daily on week days.
Initial download of the metrics may take a while.