Fig. 3
Download original image
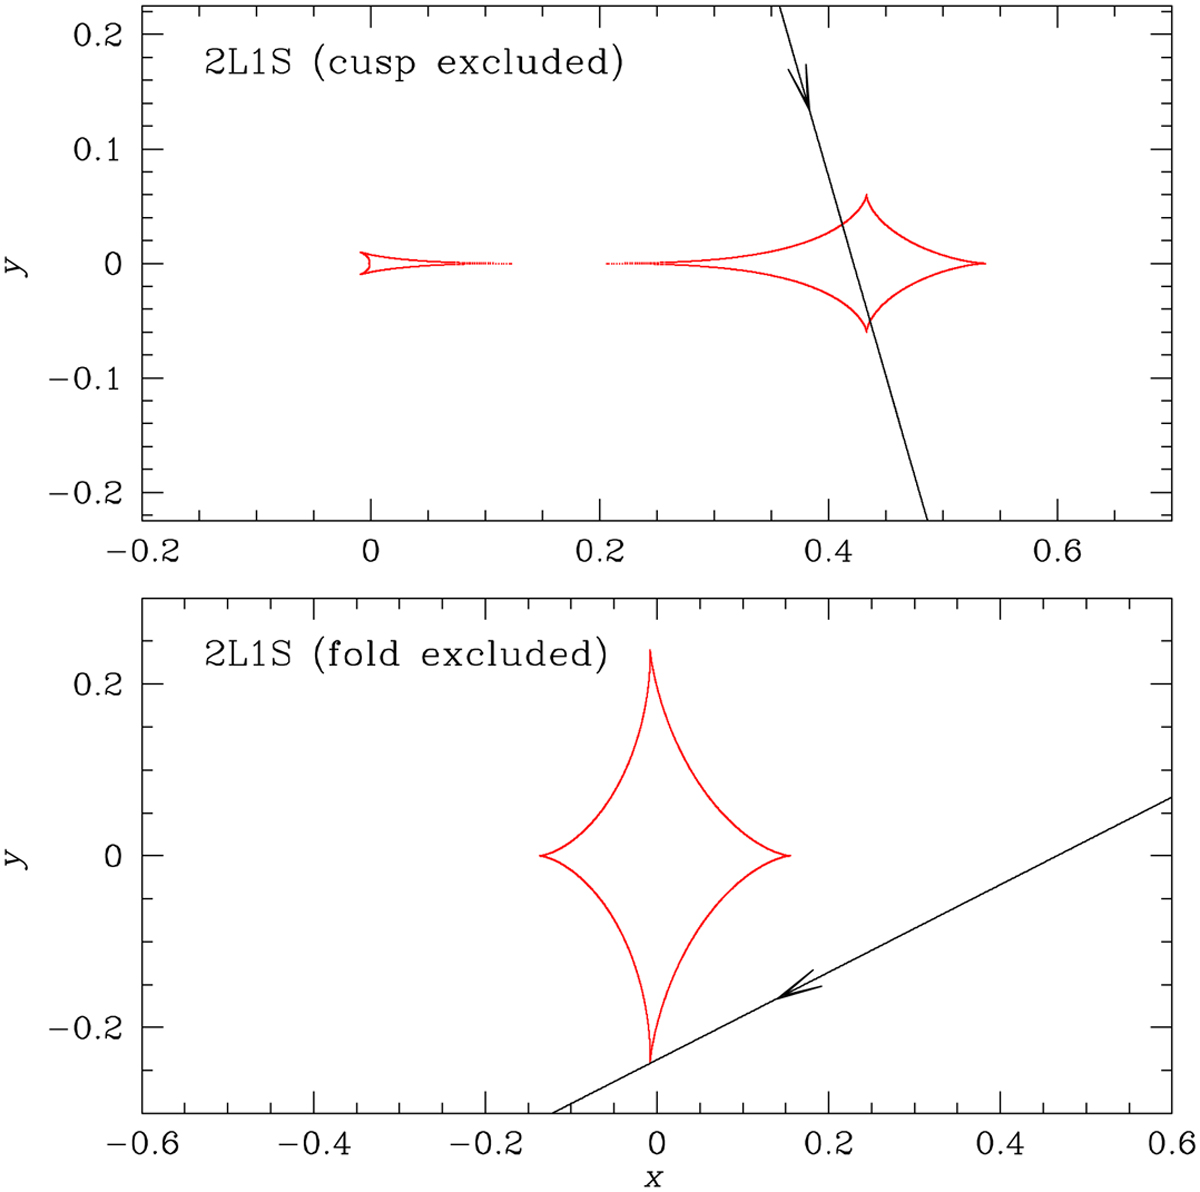
Lens system configurations of the two 2L1S solutions for which the model curves are presented in the corresponding panels of Fig. 2. In each panel, the red figure is the caustic, the line represents the source trajectory, and the arrow on the source trajectory indicates the direction of the source motion. By convention, the abscissa of these 2L1S diagrams is defined by the binary axis of the lens system.
Current usage metrics show cumulative count of Article Views (full-text article views including HTML views, PDF and ePub downloads, according to the available data) and Abstracts Views on Vision4Press platform.
Data correspond to usage on the plateform after 2015. The current usage metrics is available 48-96 hours after online publication and is updated daily on week days.
Initial download of the metrics may take a while.