Open Access
Fig. 9.
Download original image
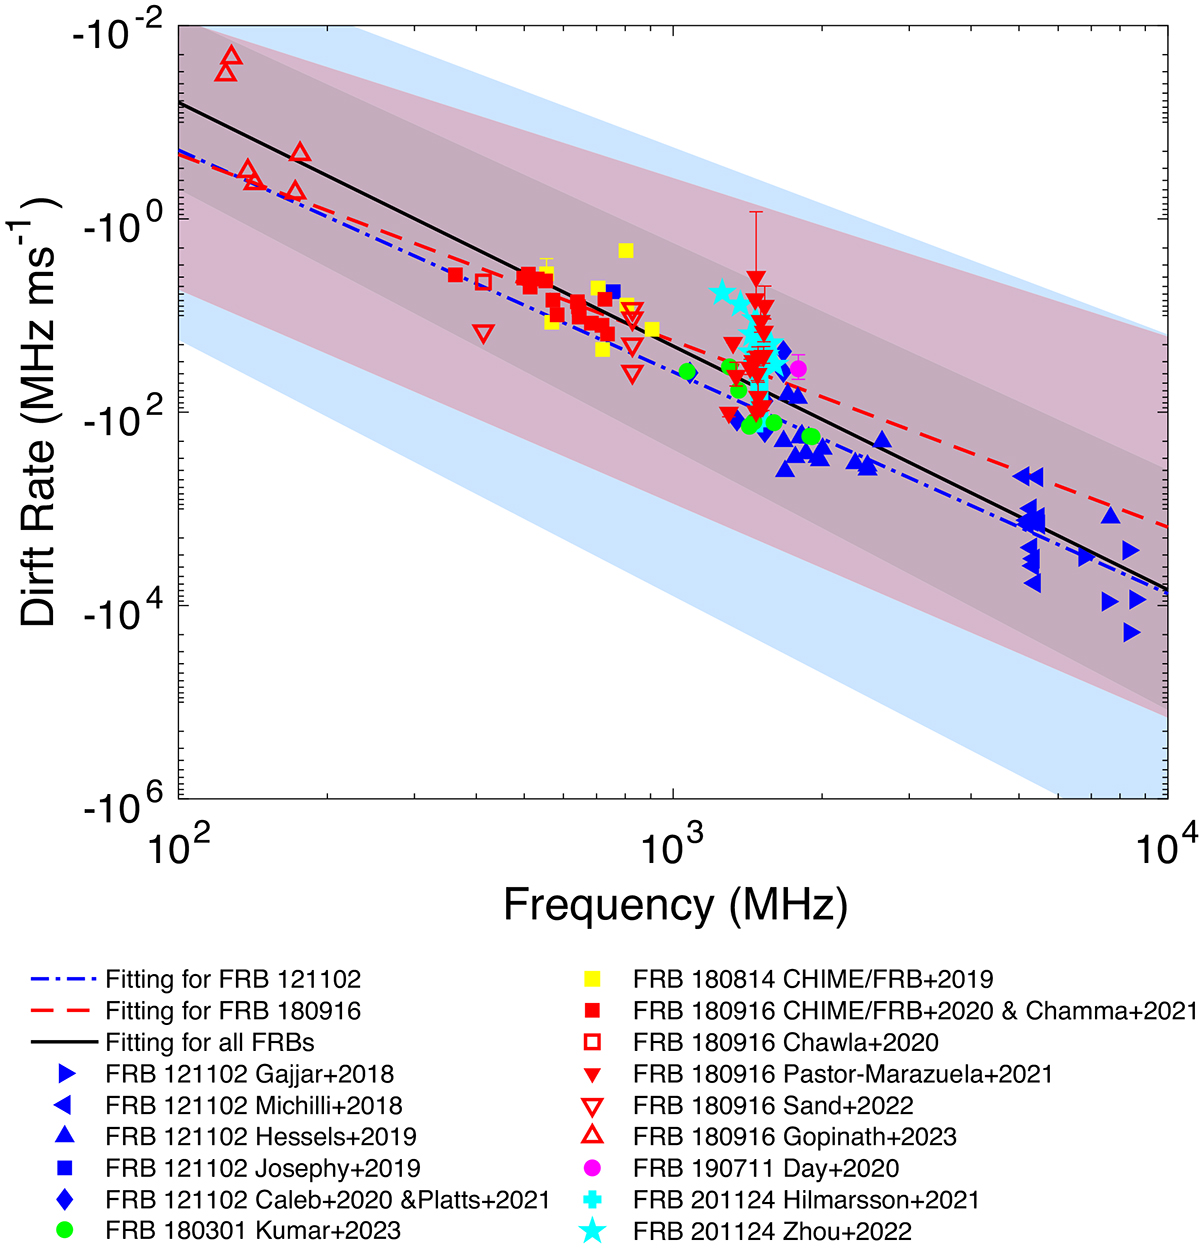
Comparison of drift rates at different frequencies. Different regions show the 1σ region of the best fitting results: FRB 20121102A (blue), FRB 180916B(red), and all FRBs (grey).
Current usage metrics show cumulative count of Article Views (full-text article views including HTML views, PDF and ePub downloads, according to the available data) and Abstracts Views on Vision4Press platform.
Data correspond to usage on the plateform after 2015. The current usage metrics is available 48-96 hours after online publication and is updated daily on week days.
Initial download of the metrics may take a while.