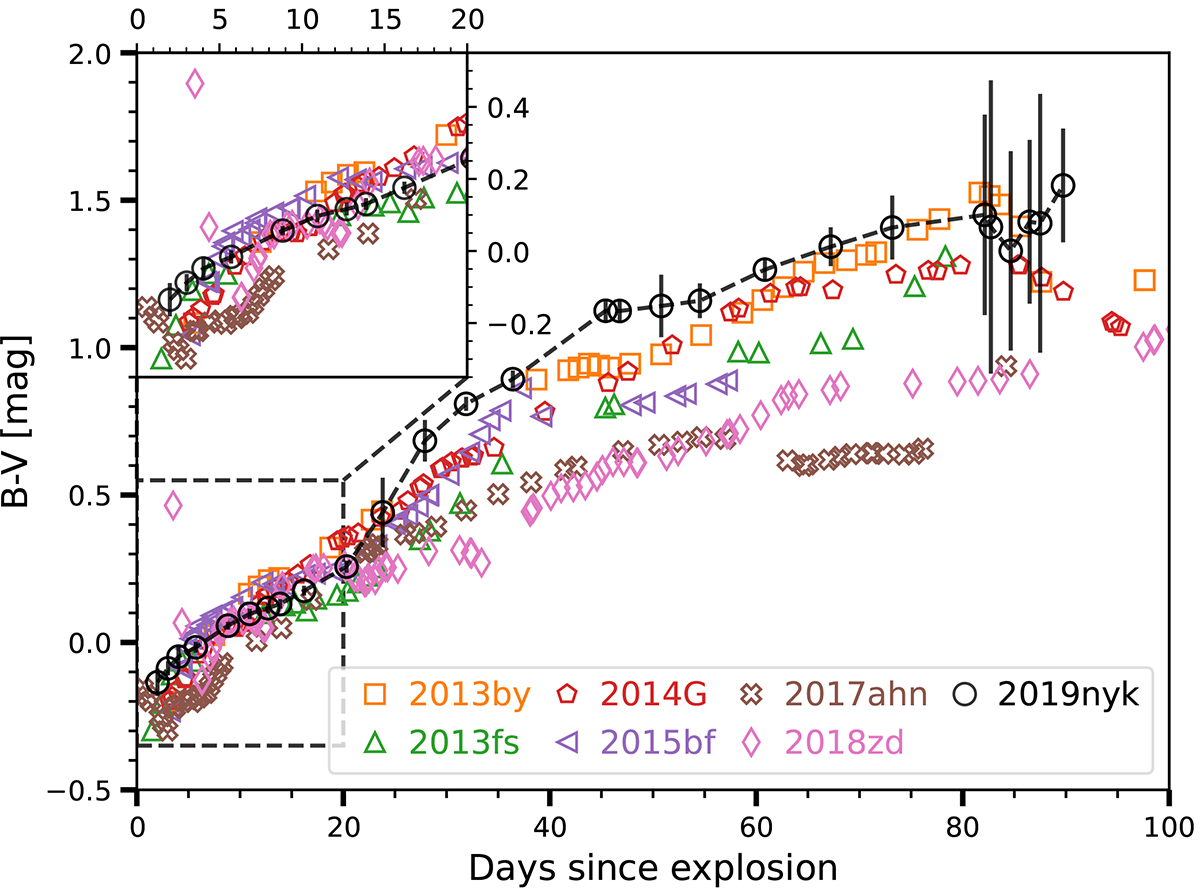
Fig. 3.
Download original image
(B − V) colour curve of SN 2019nyk compared to those of the comparison sample SNe. Prior to estimating the colour, LOESS regression was applied to smooth out the B and V band LCs of all SNe. The inset plot shows a zoom-in of the first 20 days of the evolution, which shows the colour evolution of SNe 2017ahn and 2018zd to bluer colours before transitioning to redder colours.
Current usage metrics show cumulative count of Article Views (full-text article views including HTML views, PDF and ePub downloads, according to the available data) and Abstracts Views on Vision4Press platform.
Data correspond to usage on the plateform after 2015. The current usage metrics is available 48-96 hours after online publication and is updated daily on week days.
Initial download of the metrics may take a while.