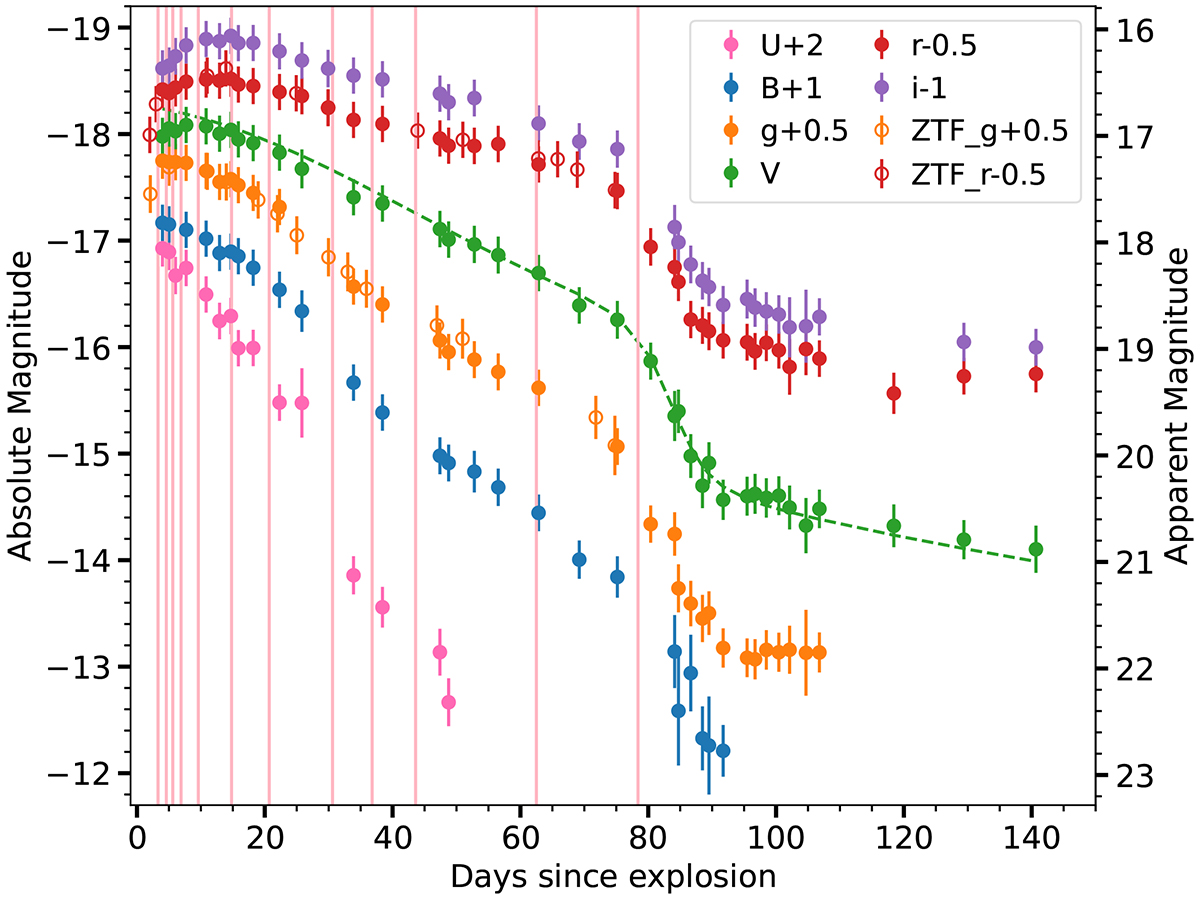
Fig. 2.
Download original image
Absolute and apparent UBgVri LCs of SN 2019nyk are shown, offset by values given in the legend. An additional shift of 0.06 and 0.11 mag are applied to the ZTF-g and r band magnitudes, respectively, to match the LCO g and r bands magnitudes. The LCO and shifted ZTF data are shown with filled symbols and open symbols, respectively. The error bars correspond to the error in the absolute magnitudes. The vertical lines denote the epochs at which a spectrum of SN 2019nyk was obtained. The dashed line shows the parametric fit to the V band LC (Olivares et al. 2010).
Current usage metrics show cumulative count of Article Views (full-text article views including HTML views, PDF and ePub downloads, according to the available data) and Abstracts Views on Vision4Press platform.
Data correspond to usage on the plateform after 2015. The current usage metrics is available 48-96 hours after online publication and is updated daily on week days.
Initial download of the metrics may take a while.