| Issue |
A&A
Volume 685, May 2024
|
|
|---|---|---|
| Article Number | A89 | |
| Number of page(s) | 14 | |
| Section | The Sun and the Heliosphere | |
| DOI | https://doi.org/10.1051/0004-6361/202348641 | |
| Published online | 08 May 2024 | |
Evolution of coronal mass ejections with and without sheaths from the inner to the outer heliosphere: Statistical investigation for 1975 to 2022
1
University of Alcalà, Alcalà de Henares, Spain
e-mail: This email address is being protected from spambots. You need JavaScript enabled to view it.
2
Institute of Physics (Heliospheric Physics Research Group), University of Graz, Graz, Austria
e-mail: This email address is being protected from spambots. You need JavaScript enabled to view it.
Received:
16
November
2023
Accepted:
22
February
2024
Abstract
Aims. This study covers a thorough statistical investigation of the evolution of interplanetary coronal mass ejections (ICMEs) with and without sheaths through a broad heliocentric distance and temporal range. The analysis treats the sheath and magnetic obstacle (MO) separately in order to gain more insight on their physical properties. In detail, we aim to unravel different characteristics of these structures occurring over the inner and outer heliosphere.
Methods. The method is based on a large statistical sample of ICMEs probed over different distances in the heliosphere. For this, information about detection times for the sheath and MO from 13 individual ICME catalogs was collected and crosschecked. The time information was then combined into a main catalog that was used as the basis for the statistical investigation. The data analysis based on this catalog covers a large number of spacecraft missions, enabling in situ solar wind measurements from 1975 to 2022. This allowed us to study the differences between solar cycles.
Results. All the structures under study (sheath, MO with and without sheath) show the biggest increase in size together with the largest decrease in density at a distance of ∼0.75 AU. At 1 AU, we found different sizes for MOs with and without a sheath, with the former being larger. Up to 1 AU, the upstream solar wind shows the strongest pileup close to the interface with the sheath. For larger distances, the pileup region seems to shift, and it recedes from that interface further into the upstream solar wind. This might refer to a change in the sheath formation mechanism (driven versus non-driven) with heliocentric distance, suggesting the relevance of the CME propagation and the expansion behavior in the outer heliosphere. A comparison to previous studies showed inconsistencies over the solar cycle, which makes more detailed studies necessary in order to fully understand the evolution of ICME structures.
Key words: Sun: coronal mass ejections (CMEs) / Sun: heliosphere / solar wind
© The Authors 2024
 Open Access article, published by EDP Sciences, under the terms of the Creative Commons Attribution License (https://creativecommons.org/licenses/by/4.0), which permits unrestricted use, distribution, and reproduction in any medium, provided the original work is properly cited.
This article is published in open access under the Subscribe to Open model. This email address is being protected from spambots. You need JavaScript enabled to view it. to support open access publication.
1. Introduction
Coronal mass ejections (CMEs) are huge structures of plasma and magnetic field that are impulsively expelled from the Sun. The low plasma beta structure, presumably a flux rope, drives the formation of other structures during its evolution through the ambient corona and interplanetary space. Close to the Sun, depending on the CME’s initial speed, size, and ambient coronal magnetic field, the so-called three-part CME is observed, typically in white-light coronagraph data. It features a front region, a void, and a center part (Riley et al. 2008; Mishra & Teriaca 2023). More recent studies applying 3D simulations and multi-spacecraft data have hinted toward a two-front morphology consisting of a shock and a piled-up sheath region (Vourlidas et al. 2013). Indeed, from in situ data, more structures may be identified, including, for fast events, a shock-sheath, leading edge, front, flux rope, and rear region (Kilpua et al. 2017; Temmer & Bothmer 2022). The review by Wimmer-Schweingruber et al. (2006) further highlighted the existence of other specific regions separated by discontinuities and the center of the flux rope being a magnetic ejecta core.
The initial signature for identifying CMEs from in situ data (referred to as interplanetary CME, or ICME) was established by Burlaga et al. (1981) and Klein & Burlaga (1982), focusing on magnetic field enhancements and the smooth rotation of the magnetic field. Subsequent studies applied alternative signatures for ICME detection. Richardson & Cane (1995) introduced the idea of combining the proton temperature with the solar wind speed to calculate expected temperature values, specifically targeting the low-temperature intervals characteristic of ICMEs. Expanding the range of signatures, Jian et al. (2006) suggested the incorporation of total perpendicular pressure as a complementary variable to identify the presence of ICMEs. Additionally, the composition of ICMEs, which remains relatively constant after their departure from the Sun, has been employed as a proxy for their detection. Henke et al. (2001) suggested as a signature, the threshold of oxygen charge state ratio O7+/O6+ > 1, while Lepri et al. (2001) and Lepri & Zurbuchen (2004) proposed average iron charge state values ⟨Q⟩Fe > 12 as an identifying signature. An alternative approach for detecting ICMEs at Earth proposed by Cane (2000) relies on observing Forbush decreases, which are marked reductions in galactic cosmic ray intensities. Due to the complexity of the structures found in the ICME, the most practical approach is to use more than one signature (Zurbuchen & Richardson 2006) in order to reliably identify ICMEs in the solar wind (Gosling 1997; Kilpua et al. 2013). In this research, most of the ICME identification processes employed in the catalogs primarily concentrate on the magnetic field strength and the rotation of the magnetic field vector (Möstl et al. 2017, 2020; Nieves-Chinchilla et al. 2018; Jian et al. 2006) along with a low proton temperature (Nieves-Chinchilla et al. 2018; Richardson & Cane 2010; Du et al. 2010) or the total pressure (Jian et al. 2006, 2018).
Under ideal circumstances, the expansion of the ICMEs in their propagation through the interplanetary medium would be compatible with self-similar expansion (Farrugia et al. 1993; Shimazu & Vandas 2002; Démoulin et al. 2008; Démoulin & Dasso 2009), that is, the velocity profile would show a linear decrease between the front and rear part of the magnetic obstacle (MO). Nevertheless, the evolution of ICMEs with heliocentric distance is far from ideal. Inspection of different ICME structures in detail has suggested that they have complex interactions with the ambient solar wind and evolutionary processes as they propagate through the interplanetary space. The interaction processes with the solar wind have revealed several effects. One is the magneto hydrodynamic (MHD) drag (Cargill 2004; Vršnak et al. 2008, 2013) producing a kinematic adjustment to the ambient solar wind flow. Another effect is the pancaking of the frontal part of the CME, which leads to a deformation of the cross section of the MO in the radial direction, producing a convex outward shape (Hidalgo 2003; Ruffenach et al. 2015). Conditions favoring magnetic reconnection between the interplanetary magnetic field and the MO produce a decrease in the ICME magnetic flux along with a decrease in the MO’s cross section area (Dasso et al. 2007; Ruffenach et al. 2012).
The ICME sheath region and its relation to the magnetic driver have gained interest in recent years (DeForest et al. 2013; Mitsakou & Moussas 2014; Masías-Meza et al. 2016; Kilpua et al. 2017; Janvier et al. 2019; Lugaz et al. 2020; Salman et al. 2020, 2021; Temmer & Bothmer 2022). The sheath is typically defined as a heated and turbulent shock-compressed material with a much larger plasma beta than the MO. Das et al. (2011) derived, through the study of synthetic CMEs in the lower corona, that the magnetic field draping around the CME front creates a pileup density compression region. DeForest et al. (2013) and Lugaz et al. (2020), using in situ measurements of ICMEs, detected the pileup region and found that the sheath can be composed not only of compressed solar wind but also of coronal material. Siscoe & Odstrcil (2008), along with Salman et al. (2021), proposed a two-way formation mechanism for the sheath caused by the propagation and expansion of the MO through the solar wind. The characteristic feature of the propagation-dominated sheath is that the solar wind largely gets deflected sideways, enabling it to flow around the obstacle. On the other hand, the expansion-dominated sheath would refer to a continuous pileup of solar wind all around the expanding MO (see also Siscoe & Odstrcil 2008). However, these would be very ideal situations, and pure propagation-dominated or pure expansion-dominated sheaths would be rare in terms of occurrence. Most likely, the formation mechanism of the sheaths might involve a combination of both mechanisms. Sheaths are therefore clearly related to the evolution of the MO that drives them but also to the background solar wind in which they form. Temmer et al. (2021) showed that the amount of piled up material of the sheath would depend on the density and solar wind flow speed and on the MO size since wider magnetic obstacles lead to a stronger mass pileup. The speed of the MO is also relevant for the sheath formation, as derived by Masías-Meza et al. (2016), who showed that more massive sheaths are related to slow magnetic obstacles at 1 AU. Janvier et al. (2019) studied ICMEs at different heliocentric distances and determined that the median magnetic field magnitude in the sheath correlates well with the MO speed at 1 AU. As the background solar wind affects the sheaths, sheaths may also affect the MO that initially drives them and later follows them, and vice versa.
In the present scientific study, our comprehensive analysis serves to corroborate and extend prior findings concerning the evolutionary patterns exhibited by magnetic ejecta as a function of heliocentric distance. Our investigation was conducted utilizing a dataset encompassing ∼2000 ICMEs between heliocentric distances of 0.25 and 5 AU. We not only extend the analyzed heliocentric distance but also the time range of previous investigations by covering two entire solar cycles and the rising part of SC25. Notably, a limited number of scientific inquiries have been dedicated to studying the sheath properties as a function of heliocentric distance or solar cycle. In this study, we address both of these aspects by delivering an exhaustive investigation into the sheath evolution, specifically focusing on variations in size and density. An additional facet of our research encompasses an exploration of how the properties of the upstream solar wind influence the propagation of ICME structures within the interplanetary medium. The investigation characterizes this interaction by assessing the ratio between the upstream solar wind and the various structural components within ICMEs.
The paper is organized as follows: Section 2 details how we define the structures present in the ICMEs along with some statistics about the percentage distribution of ICMEs according to heliocentric distance and solar cycle. Section 3 provides the results we obtained, where Sect. 3.1 shows the differences in size between the substructures and Sect. 3.2 shows the differences in density along with the relation with the upstream solar wind. Our study of the evolution of the structures with solar cycles is in Sect. 3.3, and how the MO would affect the sheath and vice versa is analyzed in Sect. 3.4. Finally, in Sects. 4 and 5, we summarize the results obtained from this research and draw some conclusions.
2. Data
The dataset used in this research is a combination of 13 in situ measured ICME catalogs from different authors. Details on each catalog and references are given in Appendix A. The dataset includes events that occurred from 1975 to 2022 (i.e., fully covering SC21–24). After removing the overlapping events, the dataset contained, 2136 separate ICMEs. Our analysis is based on the in-ecliptic sample of data, with spacecraft locations between −10° and +10°. The 2003 in-ecliptic ICME events in the original catalogs are identified according to start and end times for sheath and MO regions. In this study, the dates are the only information inherited from the original catalogs, and they allowed us to classify the ICMEs into two types: ICMEs with a sheath region ahead of the MO (ICME I) and ICMEs without a clearly identified sheath region ahead of the MO (ICME II). Hence, ICME I consists of two structures, a sheath and MO Cat I, while ICME II covers only one structure, the MO Cat II. The two ICME categories and upstream solar wind regions are visualized in Fig. 1.
 |
Fig. 1. Definition of ICME structures and ambient solar wind upstream of the ICME. |
During the time range between 1975 and 2022, several spacecraft missions were sampling ICMEs over different distances. Helios data cover 1976–1981 and a distance range of 0.3–1AU (Scearce et al. 1975), and Ulysses covers 1990–2007 and a distance range of 1.3–5.42 AU (Balogh et al. 1992). The spacecraft located at 1 AU are: ACE, 1997–active (McComas et al. 1998); Wind, 1994–active (Ogilvie & Parks 1996); STEREO, 2006–active Kaiser et al. (2008); while the following have a distance range into the inner heliosphere; Parker Solar Probe, 2018–active over 0.05–1AU (Fox et al. 2016) and Solar Orbiter 2020–active over 0.28–1AU (Müller & Marsden 2013). Other spacecraft located in different planets have detected ICMEs, such as MAVEN (Jakosky et al. 2015); VEX (Svedhem et al. 2007); MESSENGER (Solomon et al. 2007); and BepiColombo (Benkhoff et al. 2021). From these missions, we obtained plasma and magnetic field measurements of the upstream solar wind, sheath, and MO (see Fig. 1).
Table 1 shows the information about the percentage distribution of ICMEs over the different solar cycles and heliocentric distances. We define the inner heliosphere as distances r < 1 AU and the outer heliosphere as distances r ≥ 1 AU (cf. second column in Table 1). Due to the lack of available spacecraft before SC23, SC20–22 cover only 5.7% of ICMEs in the dataset. While SC23 and SC24 show a drop in ICME type II, the decrease in SC24 is slightly higher. Overall, the best data coverage is given for SC24 over the inner heliosphere.
Percentage distribution (%) of ICME distribution for each solar cycle and distance.
3. Results for in-ecliptic ICMEs
3.1. Size evolution with heliocentric distance
For the 2003 in-ecliptic ICMEs, we calculated their size (S) by multiplying the average speed by the duration (i.e., S = ⟨v⟩⋅Δt). To study the size evolution of each structure as a function of heliocentric distance, we followed two approaches: (1) To be comparable with previous studies, we fit the data with a power law function, S = δ ⋅ rβ, covering three distance ranges (the fitting parameters are detailed in Table 2). (2) We calculated the statistical distribution of the size covering six distance ranges (detailed in Table 3).
Power law size fitting parameters (S = δ ⋅ rβ) for each structure and heliocentric distance.
Percentage distribution (%) of ICMEs in each distance interval.
Table 2 gives the power law fitting parameters for the three structures (sheath, MO Cat I, and MO Cat II) in three different distance ranges: (1) inner and outer heliosphere (between 0.25 and 5.42 AU); (2) inner heliosphere (r < 1 AU); and (3) outer heliosphere (r ≥ 1 AU). 72% of the ICMEs were measured in the inner heliosphere, with 60% being ICME I. On the other hand, 28% of the ICMEs were measured in the outer heliosphere, of which 58% are ICME I. In Table 2, the structure labeled as  refers to the average power law fitting parameters obtained from previous studies (a detailed review of these is given in Appendix B.1). The different results show clear differences in the size and expansion behavior of the structures.
The power law fitting parameters given in Table 2 suggest that the δ parameter (i.e., the size of the MO at 1 AU) is ∼15% bigger for MO Cat I than MO Cat II. This result is independent of the heliocentric distance, revealing a small standard deviation of the data. The β values of MO Cat I and II (i.e., the trend of the size with heliocentric distance) are clearly dependent on the distance range chosen and reveal a high standard deviation. The evolution over heliocentric distance suggests that MO Cat I events undergo a stronger expansion (i.e., higher β) in comparison to MO Cat II events.
The distance ranges chosen allowed for comparison of our results with those from previous studies that used the same power law fitting method. The term  in Table 2 represents the average value and standard deviation of the power law fitting parameters as given in previous studies. We note that the sheath structures were not considered in most of these studies. According to the distance range sampled by the different authors, the definition of the distance ranges is inner and outer (ca. 0.3–5.4 AU), inner (ca. 0.1–1 AU), and outer (ca. 1.4–5.4 AU). A comparison with our results showed that the MO size for both categories at 1 AU is larger for the entire distance range, while a good match was obtained for the inner heliosphere (averaged for MO Cat I and II δ = 0.254).
The derived sheath β parameter revealed a large standard deviation in the outer heliosphere. However, for the dataset covering the entire heliosphere and the inner heliosphere only, the standard deviation is low. From this, we may conclude that the average value of β indicates a sheath size evolution that is bigger than that derived from previous studies (β = 0.48).
In order to analyze the evolution with heliocentric distance in more detail, we binned the distance range into six bins, each with a width of 0.25 AU. For better interpretation of the reliability of statistical results within each bin, Table 3 shows the percentage of ICMEs in each distance interval. It should be noted that most of the ICMEs are located around 1 AU.
Figure 2 shows the boxplots for each distance interval detailed in Table 3. Each box provides the values of the first (Q1), second (Q2, median), and third quartile (Q3) from the data distribution. The interquartile range (IQR) is the difference of Q3 − Q1. The upper and lower whiskers are defined as Q3 + 1.5⋅IQR and Q1 − 1.5⋅IQR, respectively. We observed a clear increase in sheath size from distance interval 2 (r ≥ 0.5 AU and r < 0.74 AU) to distance interval 3 (r ≥ 0.75 AU and r < 0.99 AU). Indeed, the median value of the size almost doubled from 0.05 AU to 0.09 AU. The IQR of distance interval 3 (r ≥ 0.75 AU and r < 0.99 AU) and 4 (r ≥ 1 AU and r < 1.24 AU) are comparable with the sheath size at 1 AU obtained from the power law fitting in the previous analysis. Beyond 1 AU (distance interval 4 and onward) the sheath size stays rather constant. We note that there are no ICME I reported for distances larger than 1.5 AU. This might be related to the distance where the ICME adjusts to the ambient solar wind flow, which reduces the number of detectable sheaths. On the other hand, we have a low coverage of ICME data in that region since ICME I above 1.25 AU covers 0.2% of the entire dataset.
Figure 3 shows the size evolution of MO Cat I (black boxes) and MO Cat II (green boxes) in the six different distance intervals detailed in Table 3. The median sizes of both MOs between 0.75 and 1.24 AU (distance intervals 3 and 4) are compatible with the results obtained from the power law fitting at 1 AU, reinforcing this result. The size of both MO categories show the same trend: a small increase in the most inner heliosphere (r < 0.75 AU, distance intervals 1 and 2), with an increase between 0.75 and 1 AU (distance intervals 2 and 3), as occurs for the sheath. Beyond this distance, the size increases slowly until r > 1.5 AU (distance interval 6), where the size of MO Cat II is almost double. We highlight that due to the small sample (2.7% of the entire dataset) and the big IQR, this result should be taken with caution. The boxplot also shows that on average, the size of MO Cat II is smaller than that of MO Cat I.
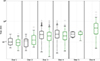 |
Fig. 3. Size boxplots of MO Cat I (black) and MO Cat II (green) for the different distance intervals detailed in Table 3. |
The strong expansion of MO Cat I might be an important factor in generating a sheath region. Results from observational data over various distance ranges, such as Bothmer & Schwenn (1998), Leitner et al. (2007), Démoulin et al. (2008), Gulisano et al. (2012), Vršnak et al. (2019), have shown that, on average, ICMEs tend to expand self-similarly, that is, the size is directly proportional to the heliocentric distance (S∝R). This self-similar expansion in the power law fitting parameters would be seen as β ∼ 1. Indeed, Gulisano et al. (2012) found by analyzing magnetic clouds from Ulysses in the outer heliosphere that non-perturbed ICMEs present an evolution compatible with a self-similar expansion. Nevertheless, when considering more complex situations such as magnetic obstacles perturbed by a high-speed stream or other MO, the evolution is no longer compatible with a self-similar expansion. Considering the separation between the inner and outer heliosphere, we derived that only MO Cat II expands self-similarly in the inner heliosphere (β = 0.805 ± 0.236), which is comparable to the average results of other authors (cf. Table 2). However, in the outer heliosphere, neither MO Cat I (β = −0.35 ± 0.853) nor MO Cat II (β = 0.576 ± 0.071) expand self-similarly. The deviation from the self-similar expansion, as explained in Gulisano et al. (2012), Vršnak et al. (2019), could be related to the magnetic reconnection between the MO and the interplanetary magnetic field or the pancaking effect, that is, the deformation in the shape of an initially circular MO, which somewhat limits the “apparent” radial expansion.
3.2. Density evolution with heliocentric distance
We applied the same methodology used for the size evolution to the density evolution. Namely, (1) we used a power law function to characterize the density evolution of the different structures over heliocentric distance, and (2) we calculated the statistical distribution of the density covering the six distance intervals from Table 3.
Table 4 summarizes our results for the density evolution, providing the derived δ and β parameters. To compare our results with those from previous works (see Appendix B.2 for details), we averaged the fitting parameters from the power law function over the various distance ranges of the inner and outer (ca. 0.3–5.4 AU), inner (ca. 0.1–1 AU), and outer (ca. 1.4–5.4 AU) heliosphere.
Power law density fitting parameters (N = δ ⋅ rβ) for each structure and heliocentric distance.
The δ of the MO Cat I and Cat II suggests that the density for both structures is very similar (between 7.1 and 7.3 cm−3) and independent of the distance. The derived results are slightly higher than those reported in previous studies over the entire distance ranges available. For the density evolution over the heliocentric distance (β), we found similar values for MO Cat I and II in the range between −2.10 and −2.20, showing a decrease in density when moving from the inner to the outer heliosphere. In comparison, the average β values from previous results ( ) are lower and derive an opposite trend for the inner and outer heliosphere (i.e., an increase in density from the inner to the outer heliosphere).
The density of the sheath at 1 AU (i.e., δ) was derived with an average value of ∼13 cm−3, revealing it to be independent of distance. Although the standard deviation of β for the outer heliosphere is high (∼±50%), the other distance ranges have standard deviations for β below 5% (β ∼ −2.1), suggesting that the decrease in density for the sheaths would be slightly lower than for the MO structures.
As we did for the size, in order to analyze the density evolution in more detail, we split the heliocentric distance into six slices (see Table 3) to obtain the boxplots that characterize the probability distribution function of the dataset, as explained before. Figure 4 shows the density boxplots for the sheath structure, where we found that the median density observed between 0.75 and 1.25 AU (distance intervals 3 and 4) are comparable with the density observed at 1 AU as obtained from the power law fitting. The sheath density evolution again shows a stronger decrease in the most inner heliosphere, below 0.75 AU (distance intervals 1 and 2). From this point onward, the density continues to decrease but at a smaller rate, followed by another drop within distance interval 5. We note that no sheath structures were detected for the heliocentric distance ≥1.5 AU (distance interval 6).
Figure 5 shows the results for the density evolution of the magnetic obstacles. The median MO density measured between 0.75 and 1.25 AU (distance intervals 3 and 4) is again compatible with the density derived at 1 AU, as obtained from the power law fitting. Furthermore, we derived that the median density values for both MO Cat I and Cat II are very similar except below 0.50 AU (distance interval 1), where MO Cat II shows a higher density than MO Cat I. The trend in the density evolution from 0.5 AU onward (distance interval 2) is similar for both MO structures and comparable to the trend derived for the sheath density evolution. Namely, there is a steeper density decrease in the most inner heliosphere followed by a more gentle decrease beginning at 0.75 AU (distance interval 3) and with another stronger decrease observed at 1.25 AU onward (distance interval 5).
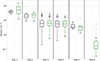 |
Fig. 5. Density boxplots of MO Cat I (black) and MO Cat II (green) for different distance intervals (detailed in Table 3). |
The solar wind’s dynamical behavior affects the propagation behavior of the ICMEs. During the propagation through the interplanetary medium, the ICME is embedded in the ambient solar wind and interacts with it. Indeed, under which conditions strong sheath regions are generated and how they impact the evolution of an ICME is not yet fully understood. In the following, we use the extensive catalog presented in this study to perform a statistical approach focusing on the density. To derive the average density of the upstream solar wind, we extracted a 48-h window ahead of the ICME and separated it into four windows (t1, t2, t3, and t4) of 12 h’ duration each (see Fig. 6).
 |
Fig. 6. Definition of upstream solar wind windows under investigation. |
We investigated how the upstream solar wind (SW) affects the sheath and the MO that interacts more directly with the solar wind, namely MO Cat II. For that, we calculated the density ratios (RT) between the upstream solar wind, with the sheaths (SH) and the MO Cat II (MOII) given by  and
and  , respectively. To cover the evolution of the ratio over heliocentric distance, we used four distance intervals: (1) r ∈ [0.25,0.7) AU; (2) r ∈ [0.7,1) AU; (3) r ∈ [1,1.5) AU; and (4) r ≥ 1.5 AU.
Figure 7 shows the density ratio of the sheath (RTSH). Each block (labeled from 1 to 4) represents a distance interval, as detailed before, and covers four boxplots of the sheath density ratio, with the same characteristics as given in Fig. 2. For all distance intervals, we obtained a median ratio bigger than one, meaning that the density of the sheath is always larger than the density of the upstream solar wind. For distance interval 1, we observed a decreasing trend in the median density ratio from t1 to t4. This behavior reflects a density increase from the farthest part of the upstream solar wind under investigation (t1) toward the interface between the solar wind and sheath (t4). This trend changes when moving to the outer heliosphere, between 0.7 and 1.5 AU (distance intervals 2 and 3). At these distance ranges, the region with the highest density seems to shift into the upstream solar wind (t3 and t2), moving away from the interface between the upstream solar wind and sheath (t4).
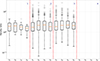 |
Fig. 7. Density ratio between the sheath and upstream solar wind according to the time windows given in Fig. 6. Each numbered block refers to a distance interval, as detailed in the text. Each box represents the result averaged over the 12-h time window. |
Figure 8 provides the density ratio of the MO Cat II (RTMOII), which has a direct interaction with the ambient solar wind, as there is no clear sheath detected according to the catalogs. Overall, we found for distance intervals between 0.25 and 1.5 AU (block 1–3), density ratios greater than one, whereas for heliocentric distances greater than 1.5 AU (block 4), the ratio density is lower than one. Hence, the density of the MO Cat II in the outer heliosphere (r ≥ 1.5 AU) is lower than the upstream solar wind, reflecting the expansion behavior of the magnetic structure. In comparison to the sheath, we did not find a clear trend in the density ratio behavior from t1 to t4 between 0.25 and 0.7 AU (within distance interval 1). Between 0.7 and 1.5 AU (distance intervals 2 and 3), the density ratio shows a small decrease from t1 to t3 and a bigger one from t3 to t4, meaning an increase in density in the nearest region to the (presumable) interface between the solar wind and MO Cat II. A possible explanation for this increase could be the presence of a sheath, undetected due to its weak characteristics. The trend above 1.5 AU (distance interval 4) suggests a higher upstream solar wind density in t2 and t3 (i.e., the central regions under study), in contrast to the trend for lower heliocentric distances. We note that for the entire heliocentric distance, the IQR of the boxplots is compatible with one, meaning the density of the upstream solar wind and the structure would be similar.
3.3. Structures and their evolution with solar cycles
The extensive catalog assembled for this study covers a large time range, allowing for investigation into the ICME structure evolution over different solar cycles (SC20–SC25). Due to the number of spacecraft available, the ICME sampling is not homogenous over time, and the percentage of ICMEs for SC20, SC21, and SC22 is only 5.7% (cf. Table 1). Therefore, we focused our analysis on SC23, SC24, and the rising phase of SC25, representing 94.3% of the ICMEs and covering more than 25 years (i.e., from 1996 to 2023). With that, we extended the results given by Kilpua et al. (2017) regarding SC24 and part of SC25. Moreover, we introduced the differentiation of the results between the inner and the outer heliosphere.
Figures 9 and 10 show the yearly average evolution of various ICME parameters for the inner and outer heliosphere, respectively, between 1996 and 2023. The colors of the lines are the same as in Fig. 1: blue for the sheaths, black for MO Cat I, and green for MO Cat II. For comparison, we added the yearly average values of the upstream solar wind parameters, indicated with orange dashed lines. The color shaded regions represent the different solar cycles: blue is SC23, green is SC24, and yellow is SC25.
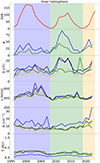 |
Fig. 9. Inner heliosphere yearly average values. The vertical color bands (blue, green, and yellow) represent SC23, 24, and part of SC25, respectively. From top to bottom, sunspot number (SSN), number of events (#), magnetic field (B), speed (v), density (N), and size (S). The red line is the SSN, while the blue, black, and green lines are the data for the sheaths, MO Cat I, and MO Cat II, respectively. The orange dashed line is the upstream solar wind yearly values. Since the number of sheaths and MO Cat I are the same, the second panel shows only the number of sheaths (blue line). |
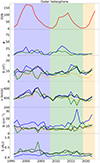 |
Fig. 10. Outer heliosphere yearly average values. The vertical color bands (blue, green, and yellow) represent SC23, 24, and part of SC25, respectively. From top to bottom, sunspot number (SSN), number of events (#), magnetic field (B), speed (v), density (N), and size (S). The red line is the SSN, while the blue, black, and green lines are the data for the sheaths, MO Cat I, and MO Cat II, respectively. The orange dashed line is the upstream solar wind yearly values. Since the number of sheaths and MO Cat I are the same, the second panel shows only the number of sheaths (blue line). |
For the inner heliosphere (Fig. 9), we observed that the number of sheaths and MO Cat I1 (blue line) in comparison with MO Cat II (green line) is bigger for the solar cycles under study. During the maximum phase of SC23, the difference is 45%, and this difference increases to 51% for SC24. In SC23, the three structures show a magnetic field higher than the average solar wind magnetic field (orange line). The sheaths (blue line) and MO Cat I (black line) show a higher magnetic field than MO Cat II (green line) during the declining phase of SC23. In SC24, there is a clear difference between the magnetic field of the sheath and MO Cat I in comparison with MO Cat II. In SC23 and SC24, the difference between MO Cat I and the upstream solar wind is 42% and 48%, respectively. The yearly average speed of the structures are rather comparable over the solar cycles. However, in the declining phase of SC23, there is a speed increase for the sheath and MO Cat I, while the MO Cat II events do not show such a clear trend and even fall below the upstream solar wind flow speed. In SC24, this increase also occurs, but it is smaller for the three structures, and again the MO Cat II speed is lower than the upstream solar wind speed. The density reflects the higher density of the sheaths in comparison with MO Cat I and MO Cat II in SC23 and SC24. Both MO categories have a density similar to that of the upstream solar wind in both solar cycles. On the other hand, a differentiation in density appears for both MOs during the rising phase of SC25, but this result should be treated carefully due to the low sample for SC25. Lastly, the size of both MOs remains almost constant in both solar cycles and is also bigger than the sheath size, which also remains constant over the solar cycles.
For the outer heliosphere (Fig. 10), we obtained rather different results than for the inner heliosphere. In SC23, the number of sheaths and MO Cat I (blue line)1 in comparison with MO Cat II (green line) in some phases are similar. Only in SC24, around the maximum, is the number of sheaths twice as numerous as MO Cat II. Regarding the magnetic field, there are no clear trends, although the magnetic field of the sheaths (blue line) and MO Cat I (black line) seem to decrease during the declining phase and are bigger than the upstream solar wind magnetic field, while the MO Cat II during SC23 vary with values above and below the upstream solar wind magnetic field. During the declining phase of both solar cycles and during the rising phase of SC23, the sheath (blue line) and MO Cat I (black line) speed is greater than the speed of MO Cat II (green line), while during the minima, the three structures present almost the same speed. In contrast to what occurs in the inner heliosphere, the speed difference over the solar cycles is rather small in the outer heliosphere. The density does not exhibit a clear dependency on the solar cycle. As expected, we observed higher densities in the sheaths compared to MO Cat I and Cat II, which have densities similar to the upstream solar wind. The size of the sheath (blue line) is smaller than that of both MO categories. The size of MO Cat II (green line) exhibits an increase during the ascending phase and reaches its maximum during SC23. Indeed, Gopalswamy et al. (2014), through a correlation analysis between the speed and angular width of CMEs, found that during SC24, the CMEs are wider than those in SC23 due to the reduction in the total pressure by approximately 40%. Gopalswamy et al. (2015) compared the properties of the magnetic obstacles in SC23 and SC24, supporting the idea of a weaker SC24 and showing that the magnetic obstacles in SC23 are bigger than in SC24.
Several authors have studied the properties of ICMEs at 1 AU through different years2, but their results show some discrepancies. During SC23, the results of the sheath density from Gopalswamy et al. (2015) provide the highest values, followed by Mitsakou & Moussas (2014) and Yermolaev et al. (2021). Results for the magnetic field of the sheath structures during SC23 are found to be the highest in Gopalswamy et al. (2015), which is in agreement with Kilpua et al. (2017), and are reported as almost twice as large as the results from Mitsakou & Moussas (2014) and Yermolaev et al. (2021). The results in previous works are also different for the sheath speed during SC23, for which Gopalswamy et al. (2015) and Kilpua et al. (2017) provide higher values than Mitsakou & Moussas (2014) and Yermolaev et al. (2021). These discrepancies are also reflected in the results of the magnetic field strength for the MOs during SC23, for which Yermolaev et al. (2021) gave values almost three times lower than the results from Gopalswamy et al. (2015) and almost two times lower than Mitsakou & Moussas (2014). The results of SC24 also differ for Gopalswamy et al. (2015) and Yermolaev et al. (2021) for the sheath and MO, although the density of the sheath is quite similar in this case. These results highlight the difficulties in finding an agreement on the mean values for each solar cycle. We do not provide the mean values for the near-Earth orbit but for the inner and outer heliosphere. Tables 5–7 show the average values calculated from our dataset for each solar cycle separately for sheaths, MO Cat I, and MO Cat II, respectively. The first block in each table are the results considering the entire dataset, that is, without filtering for the inner (i.e., r < 1 AU; second block) or outer (i.e.,r ≥ 1 AU; third block) heliosphere.
Average sheath values according to the different solar cycles and heliocentric distance.
Average MO Cat I values according to the different solar cycles and heliocentric distance.
Average MO Cat II values according to the different solar cycles and heliocentric distance.
The sheath results from previous authors about the evolution with solar cycles all agree on a decreasing speed and magnetic field from SC23 to SC24. The speed of the sheaths according to our results for SC23 to SC24 (see Table 5) also show a decreasing speed. However, regarding density, Yermolaev et al. (2021) showed an increase from SC23 to SC24, while Gopalswamy et al. (2015) obtained a decrease in density. Our results show a decrease in density for all distance ranges studied i.e., considering the entire heliocentric distances, only the inner heliosphere, and only the outer heliosphere. Yermolaev et al. (2021) and Gopalswamy et al. (2015) showed a decrease in magnetic field from SC23 to SC24; nevertheless, we obtained an increase in magnetic field, except when only considering the outer heliosphere, however the standard deviation of some results for SC24 are high. The sheath size decreases from SC23 to SC24, although these values are slightly lower than those from Gopalswamy et al. (2015). The trend in SC25 reinforces the idea of a decreasing speed, magnetic field, and size. Nevertheless, the density follows the increasing trend from the previous solar cycles. These trends for SC25 should be treated carefully since we have a small dataset for this cycle.
Yermolaev et al. (2021) analyzed the physical characteristics of the sheaths and ejecta separately. They obtained almost the same density for SC23 and SC24. The density of MO Cat II that we found agrees with this result but when only considering the outer heliosphere dataset. When considering either only the inner heliosphere or the entire dataset, we obtained higher values with a decreasing trend. Something similar occurred with the magnetic field. We observed an increasing trend, while Yermolaev et al. (2021) obtained similar values but with a small decrease. The speed trend we found is toward decreasing values, agreeing with the results from Yermolaev et al. (2021). We found the size of MO Cat II with the solar cycles showed a decreasing trend that seems to continue in SC25.
For MO Cat I (see Table 6), it showed almost the same trend as MO Cat II (see Table 7): a decrease in density from SC23 to SC24 followed by an increase in SC25, although the values are slightly higher. For the speed of MO Cat I, a decreasing trend was also observed but with higher values than MO Cat II. The size of both MO Cat I and MO Cat II decreases around 50% from SC23 to SC25. Lastly, regarding the values for the magnetic field strength, although the values in SC24 have a high standard deviation, they suggest a decrease in the inner and outer heliosphere, but when considering the entire dataset, a small increase appears.
3.4. Magnetic obstacle Cat I and sheath ratio
In this section, we study the ratio between the sheaths and MO Cat I (i.e., the MO that drives and follows the sheath). For this, we split the heliocentric distance into three parts, r < 0.95 AU, r ∈ [0.95, 1.05] AU, and r > 1.05 AU, and we defined the ratio as RT = xMOI/xSH, with x as the size or speed. Figures 11 and 12 show the speed and size ratios, respectively. The numbered blocks represent the result for each distance interval: the inner heliosphere, 1 AU, and the outer heliosphere.
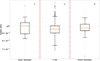 |
Fig. 11. Speed ratio between MO Cat I and the sheath for different distance intervals. |
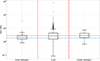 |
Fig. 12. Size ratio between MO Cat I and the sheath for different distance intervals. The blue dashed lines are the size ratio for the propagation and expansion type mechanisms according to Salman et al. (2021). |
Figure 11 suggests that the speed ratio decreases from the inner to the outer heliosphere. In the inner heliosphere, it is slightly higher than one, drops to 0.95 at 1 AU, and increases to 0.97 in the outer heliosphere. In the three cases, the IQR is close to one, suggesting that both structures have a similar speed.
Over the entire distance interval, the size ratios of the structures of MO Cat I are bigger than those of the sheaths. Indeed, Fig. 12 shows that the size ratio increases by ∼15% in each distance interval. Salman et al. (2021) proposed, by analyzing 106 sheath regions near 1 AU using data from STEREO, a categorization of the sheaths according to their formation process: i) pure propagation-dominated sheaths, where solar wind tends to flow around the MO at a distance that is related to the relative speed between the MO and the solar wind, and ii) pure expansion-dominated sheaths, where solar wind is continuously piled-up over the entire extent of the structure due to the increasing size of the expanding MO. They obtained a size ratio between the MO and the sheath of 1.9 and 2.9 for the propagation and expansion type of formation, respectively. This ratio is represented by the blue dashed lines in Fig. 12. Although the pure propagation or pure expansion formation mechanisms are uncommon, our results suggest that in the inner heliosphere there is a combination of both mechanisms. However, when moving to 1 AU and in the outer heliosphere, the dominant mechanism seems to be the expansion formation mechanism.
We further derived the correlation between the physical magnitudes of the sheath and MO Cat I. Salman et al. (2020) analyzed the correlation coefficient (CC) of around 150 ICMEs seen by STEREO. In their work, they divided the ICMEs into three different categories according to the presence of the sheath and shock. They obtained a CC of 0.91 between the speed of the magnetic ejecta and the sheath as well as a CC of 0.64 between the magnetic fields of both structures. It should be noted that these values are for the ICMEs with the sheath and shock, although their results for ICMEs only with the sheath are very similar. Table 8 shows the CC and its statistical significance according to the p-value test. The CCs in parentheses are those found to be lower than 0.5 and statistically not significant, whereas the CCs in brackets are those lower than 0.5 but statistically significant. We found very strong correlations for the speed of both structures (CC #1) over all the distance intervals, with CC ∼ 0.9 in the three regions, which agrees with the results from Salman et al. (2020). The correlation between the magnetic fields (CC #2) is also high, especially in the inner and outer heliosphere. At 1 AU, the correlation was found to be moderate, weaker than what was derived by Salman et al. (2020). For the other parameters, we got, at least for one of the distance intervals, a CC lower than 0.5. We note that the number of ICMEs is not homogeneously distributed over the different distance intervals. The highest number of ICMEs is at 1 AU (983) followed by the inner heliosphere (177) and then the outer heliosphere (83). Therefore, the CCs obtained for the outer heliosphere should be treated carefully since the number of events is low, even if they are statistically significant (e.g., CC #8 and CC #9). We found a strong correlation between the speed of MO Cat I and the temperature of the sheath (CC #3) in the inner heliosphere and at 1 AU. Between the MO Cat I magnetic field and the sheath temperature, CC #4 shows strong and statistically relevant CCs only in the inner heliosphere, and CC #5 and #6 reveal very strong CCs only in the outer heliosphere. Nevertheless, in the inner heliosphere and at 1 AU, these CCs are moderate or weak, suggesting that they would not be relevant. On the other hand, CC #7, #8, and #9 show moderate CCs, especially in the inner heliosphere and at 1 AU, suggesting a relevant correlation. Lastly, CC #10 is the only example with a moderate anti-correlation in the inner heliosphere, while at 1 AU and in the outer heliosphere, there is no relevant correlation found.
Correlation coefficients between the physical magnitudes of the sheath and MO Cat I.
4. Summary and discussion
In this research, we have gathered and compiled the results from 13 individual catalogs to create a dataset of more than 2000 separate ICMEs. We classified these ICMEs as ICME I or ICME II according to the presence (or lack) of a sheath, allowing us to define three structures: sheaths, MO Cat I, and MO Cat II (see Fig. 1). Due to the large sample obtained, the distance range of the dataset covers the inner heliosphere (0.25 AU) up to the outer heliosphere (5.42 AU) over the time range of 1975–2022.
4.1. General evolution
The size evolution of the magnetic obstacles was found to be similar for both categories, but MO Cat I was on average derived to be larger than MO Cat II over the distance range 0.75–1.25 AU. Investigating the evolution of the MO Cat II with distance, we derived only for the inner heliosphere a result consistent with a self-similar expansion (S ∝ R) as defined by Farrugia et al. (1993), Démoulin & Dasso (2009). The MO Cat II evolution from the inner to the outer heliosphere may be affected by some mechanism such as reconnection and the “pancaking effect” (Ruffenach et al. 2015), which produces a non-self-similar expansion. For both MO categories, we derived the largest increase in size around 0.75 AU. Indeed, Scolini et al. (2021), through the combined analysis of CME modeling and in situ data of a halo CME in July 2012, found a phase of rapid expansion up to ∼0.4 AU in response to the rapidly decreasing pressure in the ambient solar wind (Démoulin & Dasso 2009). The sheath size evolution follows a similar trend, revealing a clear increase around 0.75 AU. The sheath size results at 1 AU from this study were found to be three times larger than reported in previous studies (Temmer & Bothmer 2022), which might reflect differences in the sample used. While the sizes between MO Cat I and MO Cat II are different at 1 AU, their densities are very similar and show a similar evolution with heliocentric distance. As expected, the sheaths reveal, on average, a higher density than the magnetic obstacles, being at 1 AU twice as dense as MO Cat I. In general, the density evolution with heliocentric distance for the three structures is very similar. The steepest density decrease is located around 0.75 AU and is clearly related to the strong size enhancement at that distance.
4.2. Sheath formation and relation to the magnetic obstacle
The identification of ICMEs with clear sheath structures allowed us to statistically investigate the interaction between the MO that drives and follows the sheath over several distance ranges. Some works have shown the relation between the MO and the sheath, such as Masías-Meza et al. (2016), Janvier et al. (2019). The speed ratio between MO Cat I and the sheath in the inner heliosphere is slightly higher than one, showing that the MO actively drives the sheath. At 1 AU and over the outer heliosphere, this ratio drops slightly below one, suggesting that at this distance, the sheath is no longer driven by the MO and might be more comparable to a freely propagating distortion. This would coincide with the shifting of the solar wind density peak further upstream, as derived for the outer heliosphere. Salman et al. (2021) proposed two sheath formation mechanisms: propagation dominated, where the solar wind largely flows around the obstacle, and expansion dominated, where the solar wind continuously piles up all around the object (Siscoe & Odstrcil 2008). According to the results from these authors, in the inner heliosphere, there seems to be a balance between the contribution of both formation mechanisms. Nevertheless, moving outward, the median size ratio between MO Cat I and the sheath increases, suggesting that the contribution of the expansion mechanism would be more relevant. In our study, we found that the size of the MO Cat I increases by about 15% in comparison with the size of the sheaths. The sheath formation mechanism therefore might change with the heliocentric distance, according to the interplay between the MO increasing in size and decreasing in speed. However, further investigation analyzing in detail the expansion profile would be needed to confirm the different sheath formation mechanisms at work at different distances from the Sun.
We also studied the CC between several parameters of the sheath and MO Cat I structures. Comparing our results with those from Salman et al. (2020), performed at 1 AU, we confirmed a high correlation between the speed of the MO and the sheath (CC = 0.91). In their work, Salman et al. (2020) also found a strong correlation between the magnetic field of both structures (CC = 0.64), but our results provide a lower CC of 0.51. The dataset used in this study enables the extending of the CC calculation to the inner and outer heliosphere. We note that the CC from the outer heliosphere, although statistically significant according to the p-value test, should be treated carefully since the sample is small in comparison with the other distance ranges. The CC between speeds in the inner and outer heliosphere is also high, with values of 0.86 and 0.88, respectively, showing that the correlation is high along the entire heliocentric distances. On the other hand, the CC of the magnetic fields in the inner (0.80) and outer heliosphere (0.82) increase in comparison to 1 AU. Other physical magnitudes have a relevant value (CC > 0.5), see Table 8. In the inner heliosphere and at 1 AU, we found a relevant CC between the speed of the MO and the temperature of the sheath as well as with the magnetic field of the sheath. We also found a correlation between the magnetic field of the MO and the density of the sheath.
4.3. Solar wind interaction
The ICMEs are embedded in the solar wind and interact with the background solar wind during propagation. To investigate changes in the interaction processes, such as compression, we analyzed the relation between the upstream solar wind and the structures that immediately follow (i.e., sheaths and MO Cat II). We calculated density ratios over four 12-h time windows prior to the start time of the respective structure. The sheath density ratio suggests that in the inner heliosphere between 0.25 and 0.7 AU, the upstream solar wind is denser near the interface between the solar wind and sheath. With a farther heliospheric distance, the density accumulation gradually decreases, and between 1 and 1.5 AU, the densest region shifts upstream, moving away from the interface between the solar wind and sheath. In contrast to the results for the sheaths, in the inner heliosphere, the MO Cat II does not show a clear trend below 0.7 AU. Between 0.7 and 1 AU, there is a small decrease, suggesting an increase in density in the nearest region to the interface between the solar wind and MO Cat II. Above 1.5 AU, our results suggest that the central region of the upstream solar wind under study would have a higher density. These results should be treated carefully since the IQR of these boxplots is compatible with one, meaning that the upstream solar wind and the MO Cat II could have the same density (i.e., they are almost balanced).
4.4. Solar cycle relations
Our dataset covers almost five solar cycles, but for statistical reasons, we focused the analysis on solar cycles SC23, SC24, and SC25 (rising phase). Kilpua et al. (2017) provided the evolution with SC23 and part of the SC24 for sheaths and ICME at 1 AU. We extended these results to the inner and outer heliosphere, and in the inner heliosphere, the number of sheaths (the same as for MO Cat I) doubled from SC23 to SC24, and the same occurred with MO Cat II. The difference between MO Cat II and MO Cat I or sheaths remains constant for SC23 and SC24, around 50%. The magnetic field of MO Cat II shows lower values than MO Cat I and the sheaths. This is most significantly revealed around the rising and maximum phase of SC24. In general, the solar wind speed of the structures (sheath, MO Cat I, and MO Cat II) exhibits an increase after the maximum of each solar cycle, with the most significant one during SC23. While the sheaths and MO Cat I show on average larger values compared to the yearly average solar wind speed, MO Cat II structures have much lower speeds, falling even below the ambient solar wind. Unlike the previous magnitudes, the evolution of density and size in the inner heliosphere does not show a clear relationship with the solar cycles. As expected, the sheaths are denser than the magnetic obstacles in both solar cycles, while their sizes are smaller. In the outer heliosphere, the number of sheaths (the same as for MO Cat I) in comparison with MO Cat II is very similar in some phases. Nevertheless, in SC24, the number doubles around the maximum phase, but it is half of what is observed in the inner heliosphere. The magnetic field strength of the sheaths and MO Cat I suggests a moderate anti-correlation with the solar cycle since there is an increase during the declining phase. On the other hand, the trend for MO Cat II is less clear, with values similar to the other structures during some years. Comparing with previous results (e.g., Mitsakou & Moussas 2014; Gopalswamy et al. 2015) of the evolution in SC23 and SC24 of the sheaths showed an agreement with the trend in speed and size. Previous results for the sheath magnetic field showed a decrease with solar cycles (Gopalswamy et al. 2015; Yermolaev et al. 2021), although our results show an increase, but with a high standard deviation. There is no clear trend for the sheath density, but we obtained a decrease with solar cycles for SC23 and SC24, whereas for SC25 there is an increase albeit with a high standard deviation. The density of MO Cat I is higher than MO Cat II, and these values agree with the results from Gopalswamy et al. (2015), especially when considering our results in the inner heliosphere. The trend obtained for the magnetic field shows an increase for the solar cycles studied, whereas the previous results show an increase. On the other hand, our results show a decrease in speed, which was also obtained in previous studies (Gopalswamy et al. 2015; Yermolaev et al. 2021).
5. Conclusions
The results obtained in this work provide important statistics on the evolution of different ICME structures (sheath, MO Cat I, and MO Cat II) and the upstream solar wind for the inner heliosphere and especially for the outer heliosphere, a distance range not fully covered yet. Our results show an abrupt change around 0.75 AU for the size and density in the three different structures we studied. Further analysis from spacecraft data for that specific distance range would be of high interest.
Although the sheath formation mechanism is still under debate, we have compared our results with those proposed by Salman et al. (2021), who classified the sheaths as either propagation dominated or expansion dominated. Applying that concept, we have shown that the sheath formation mechanisms might change with the heliocentric distance, from being more propagation dominated into more expansion dominated. We also highlighted the relation between the sheath and the MO, stating the importance of sheaths in the formation and evolution of magnetic obstacles. Since sheaths are the direct interface to the ambient solar wind, we find the relation between the upstream solar wind and the structures of the ICMEs to be important and state that it should be studied further to enhance our understanding of ICME propagation and evolution in general. Results from this study provide valuable insights for CME model development, which could be useful to produce more accurate forecasts, helping improve space weather tools and alerts.
We note that the number of sheaths and MO Cat I are the same.
A detailed review of the results from previous authors can be found in Appendix B.3.
Acknowledgments
C. Larrodera acknowledges the program ‘Ayudas para la recualificación del sistema universitario español – UAH. Modalidad Margarita Salas 2021–2023’ through the Spanish Ministry of Universities. Disclosure of Potential Conflicts of Interest: The authors declare that there are no conflicts of interest.
References
- Balogh, A., Beek, T. J., Forsyth, R. J., et al. 1992, A&AS, 92, 221 [NASA ADS] [Google Scholar]
- Benkhoff, J., Murakami, G., Baumjohann, W., et al. 2021, Space Sci. Rev., 217, 90 [NASA ADS] [CrossRef] [Google Scholar]
- Bothmer, V., & Schwenn, R. 1998, Ann. Geophys., 16, 1 [Google Scholar]
- Burlaga, L., Sittler, E., Mariani, F., & Schwenn, R. 1981, J. Geophys. Res., 86, 6673 [Google Scholar]
- Cane, H. V. 2000, Space Sci. Rev., 93, 55 [NASA ADS] [CrossRef] [Google Scholar]
- Cane, H. V., & Richardson, I. G. 2003, J. Geophys. Res. (Space Phys.), 108, 1156 [NASA ADS] [CrossRef] [Google Scholar]
- Cargill, P. J. 2004, Sol. Phys., 221, 135 [Google Scholar]
- Chen, J. 1996, J. Geophys. Res., 101, 27499 [NASA ADS] [CrossRef] [Google Scholar]
- Das, I., Opher, M., Evans, R., Loesch, C., & Gombosi, T. I. 2011, ApJ, 729, 112 [NASA ADS] [CrossRef] [Google Scholar]
- Dasso, S., Nakwacki, M. S., Démoulin, P., & Mandrini, C. H. 2007, Sol. Phys., 244, 115 [Google Scholar]
- DeForest, C. E., Howard, T. A., & McComas, D. J. 2013, ApJ, 769, 43 [NASA ADS] [CrossRef] [Google Scholar]
- Démoulin, P., & Dasso, S. 2009, A&A, 498, 551 [Google Scholar]
- Démoulin, P., Nakwacki, M. S., Dasso, S., & Mandrini, C. H. 2008, Sol. Phys., 250, 347 [Google Scholar]
- Du, D., Zuo, P. B., & Zhang, X. X. 2010, Sol. Phys., 262, 171 [NASA ADS] [CrossRef] [Google Scholar]
- European Commission and Directorate-General for Enterprise and Industry 2014, Into space - EU space research - Space research projects under the 7th framework programme for research (6th call) (Publications Office) [Google Scholar]
- Farrugia, C. J., Burlaga, L. F., Osherovich, V. A., et al. 1993, J. Geophys. Res., 98, 7621 [Google Scholar]
- Fox, N. J., Velli, M. C., Bale, S. D., et al. 2016, Space Sci. Rev., 204, 7 [Google Scholar]
- Gopalswamy, N., Akiyama, S., Yashiro, S., et al. 2014, Geophys. Res. Lett., 41, 2673 [NASA ADS] [CrossRef] [Google Scholar]
- Gopalswamy, N., Yashiro, S., Xie, H., Akiyama, S., & Mäkelä, P. 2015, J. Geophys. Res. (Space Phys.), 120, 9221 [NASA ADS] [CrossRef] [Google Scholar]
- Gosling, J. T. 1997, Geophys. Union Geophys. Monogr. Ser., 99, 9 [Google Scholar]
- Gulisano, A. M., Démoulin, P., Dasso, S., & Rodriguez, L. 2012, A&A, 543, A107 [NASA ADS] [CrossRef] [EDP Sciences] [Google Scholar]
- Gulisano, A. M., Démoulin, P., Dasso, S., Ruiz, M. E., Marsch, E., et al. 2010, in Evolution of magnetic clouds in the inner heliosphere, eds. M. Maksimovic, K. Issautier, N. Meyer-Vernet, et al., AIP Conf. Ser., 1216, 391 [NASA ADS] [Google Scholar]
- Henke, T., Woch, J., Schwenn, R., et al. 2001, J. Geophys. Res., 106, 10597 [NASA ADS] [CrossRef] [Google Scholar]
- Hidalgo, M. A. 2003, J. Geophys. Res. (Space Phys.), 108, 1320 [NASA ADS] [CrossRef] [Google Scholar]
- Jakosky, B. M., Lin, R. P., Grebowsky, J. M., et al. 2015, Space Sci. Rev., 195, 3 [CrossRef] [Google Scholar]
- Janvier, M., Winslow, R. M., Good, S., et al. 2019, J. Geophys. Res. (Space Phys.), 124, 812 [NASA ADS] [CrossRef] [Google Scholar]
- Jian, L., Russell, C. T., Luhmann, J. G., & Skoug, R. M. 2006, Sol. Phys., 239, 393 [NASA ADS] [CrossRef] [Google Scholar]
- Jian, L. K., Russell, C. T., Luhmann, J. G., & Galvin, A. B. 2018, ApJ, 855, 114 [Google Scholar]
- Kaiser, M. L., Kucera, T. A., Davila, J. M., et al. 2008, Space Sci. Rev., 136, 5 [Google Scholar]
- Kilpua, E. K. J., Isavnin, A., Vourlidas, A., Koskinen, H. E. J., & Rodriguez, L. 2013, Ann. Geophys., 31, 1251 [NASA ADS] [CrossRef] [Google Scholar]
- Kilpua, E., Koskinen, H. E. J., & Pulkkinen, T. I. 2017, Liv. Rev. Sol. Phys., 14, 5 [Google Scholar]
- Klein, L. W., & Burlaga, L. F. 1982, J. Geophys. Res., 87, 613 [Google Scholar]
- Kumar, A., & Rust, D. M. 1996, J. Geophys. Res., 101, 15667 [Google Scholar]
- Leitner, M., Farrugia, C. J., Möstl, C., et al. 2007, J. Geophys. Res. (Space Phys.), 112, A06113 [Google Scholar]
- Lepri, S. T., & Zurbuchen, T. H. 2004, J. Geophys. Res., 109, A01112 [NASA ADS] [Google Scholar]
- Lepri, S. T., Zurbuchen, T. H., Fisk, L. A., et al. 2001, J. Geophys. Res., 106, 29231 [NASA ADS] [CrossRef] [Google Scholar]
- Liu, Y., Richardson, J. D., & Belcher, J. W. 2005, Planet. Space Sci., 53, 3 [Google Scholar]
- Lugaz, N., Winslow, R. M., & Farrugia, C. J. 2020, J. Geophys. Res. (Space Phys.), 125, e27213 [NASA ADS] [Google Scholar]
- Masías-Meza, J. J., Dasso, S., Démoulin, P., Rodriguez, L., & Janvier, M. 2016, A&A, 592, A118 [NASA ADS] [CrossRef] [EDP Sciences] [Google Scholar]
- McComas, D. J., Bame, S. J., Barker, P., et al. 1998, Space Sci. Rev., 86, 563 [CrossRef] [Google Scholar]
- Mishra, W., & Teriaca, L. 2023, J. Astrophys. Astron., 44, 20 [NASA ADS] [CrossRef] [Google Scholar]
- Mitsakou, E., & Moussas, X. 2014, Sol. Phys., 289, 3137 [NASA ADS] [CrossRef] [Google Scholar]
- Möstl, C., Isavnin, A., Boakes, P. D., et al. 2017, Space Weather, 15, 955 [CrossRef] [Google Scholar]
- Möstl, C., Weiss, A. J., Bailey, R. L., et al. 2020, ApJ, 903, 92 [Google Scholar]
- Müller, D., Marsden, R. G., & St. Cyr, O. C., Gilbert, H. R., 2013, Sol. Phys., 285, 25 [CrossRef] [Google Scholar]
- Nieves-Chinchilla, T., Vourlidas, A., Raymond, J. C., et al. 2018, Sol. Phys., 293, 25 [NASA ADS] [CrossRef] [Google Scholar]
- Ogilvie, K. W., & Parks, G. K. 1996, Geophys. Res. Lett., 23, 1179 [CrossRef] [Google Scholar]
- Regnault, F., Janvier, M., Démoulin, P., et al. 2020, J. Geophys. Res. (Space Phys.), 125, e28150 [NASA ADS] [Google Scholar]
- Richardson, I. G., & Cane, H. V. 1995, J. Geophys. Res., 100, 23397 [Google Scholar]
- Richardson, I. G., & Cane, H. V. 2010, Sol. Phys., 264, 189 [NASA ADS] [CrossRef] [Google Scholar]
- Riley, P., Lionello, R., Mikić, Z., & Linker, J. 2008, ApJ, 672, 1221 [NASA ADS] [CrossRef] [Google Scholar]
- Ruffenach, A., Lavraud, B., & Owens, M. J. 2012, J. Geophys. Res. (Space Phys.), 117, A09101 [NASA ADS] [CrossRef] [Google Scholar]
- Ruffenach, A., Lavraud, B., Farrugia, C. J., et al. 2015, J. Geophys. Res. (Space Phys.), 120, 43 [Google Scholar]
- Salman, T. M., Lugaz, N., & Farrugia, C. J. 2020, ApJ, 904, 177 [NASA ADS] [CrossRef] [Google Scholar]
- Salman, T. M., Lugaz, N., Winslow, R. M., et al. 2021, ApJ, 921, 57 [NASA ADS] [CrossRef] [Google Scholar]
- Scearce, C., Cantarano, S., Ness, N., et al. 1975, Raumfahrtforschung, 19, 237 [NASA ADS] [Google Scholar]
- Scolini, C., Dasso, S., Rodriguez, L., Zhukov, A. N., & Poedts, S. 2021, A&A, 649, A69 [NASA ADS] [CrossRef] [EDP Sciences] [Google Scholar]
- Shimazu, H., & Vandas, M. 2002, Earth. Planets Space, 54, 783 [Google Scholar]
- Siscoe, G., & Odstrcil, D. 2008, J. Geophys. Res. (Space Phys.), 113, A00B07 [Google Scholar]
- Solomon, S. C., McNutt, R. L., Gold, R. E., & Domingue, D. L. 2007, Space Sci. Rev., 131, 3 [NASA ADS] [CrossRef] [Google Scholar]
- Svedhem, H., Titov, D. V., McCoy, D., et al. 2007, Planet. Space Sci., 55, 1636 [Google Scholar]
- Temmer, M., & Bothmer, V. 2022, A&A, 665, A70 [NASA ADS] [CrossRef] [EDP Sciences] [Google Scholar]
- Temmer, M., Holzknecht, L., & Dumbović, M. 2021, J. Geophys. Res. (Space Phys.), 126, e28380 [NASA ADS] [Google Scholar]
- Vourlidas, A., Lynch, B. J., Howard, R. A., & Li, Y. 2013, Sol. Phys., 284, 179 [NASA ADS] [Google Scholar]
- Vršnak, B., Vrbanec, D., & Čalogović, J. 2008, A&A, 490, 811 [NASA ADS] [CrossRef] [EDP Sciences] [Google Scholar]
- Vršnak, B., Žic, T., & Vrbanec, D. 2013, Sol. Phys., 285, 295 [CrossRef] [Google Scholar]
- Vršnak, B., Amerstorfer, T., & Dumbović, M. 2019, ApJ, 877, 77 [CrossRef] [Google Scholar]
- Wang, C., Du, D., & Richardson, J. D. 2005, J. Geophys. Res. (Space Phys.), 110, A10107 [NASA ADS] [CrossRef] [Google Scholar]
- Wimmer-Schweingruber, R. F., Crooker, N. U., Balogh, A., et al. 2006, Space Sci. Rev., 123, 177 [Google Scholar]
- Yermolaev, Y. I., Lodkina, I. G., Khokhlachev, A. A., et al. 2021, J. Geophys. Res. (Space Phys.), 126, e29618 [NASA ADS] [Google Scholar]
- Zurbuchen, T. H., & Richardson, I. G. 2006, Space Sci. Rev., 123, 31 [Google Scholar]
Appendix A: Description of catalogs
Table A.1 details the references of the individual catalogs used to obtain the combined catalog analyzed in this research. The column named "Sheath" specifies if the catalog considers the presence of sheaths or not.
References of the individual catalogs used.
As the different catalogs partly cover the same ICMEs, we removed all duplicates. To do so, we cross checked catalogs from single spacecraft measurements with those from multiple spacecraft (catalog #1 and #8). First, we set the time range associated with each ICME entry in the catalogs from a single spacecraft. Second, we determined whether the time range identified in step 1 intersects with any ICME time ranges in the base catalog. Third, if there was no overlap as described in step 2, we included this ICME entry in our final catalog.
After combining the catalogs and removing the repeated events, we obtained the 2136 separate ICMEs, from which 2003 belongs to the in-ecliptic ICMEs (i.e., latitude between −10° and +10°). The individual contributions to the final ICME catalog are detailed in Table A.2. The second and third column show the percentage of contribution to the entire final ICME catalog and the in-ecliptic ICME catalog, respectively. As can be noted, the main difference is the decrease of the ULYSSES ICMEs catalog when considering the in-ecliptic ICMEs.
Percentage of contribution from the individual catalogs. The second column shows the contribution to the entire catalog, and third column shows the contribution to the entire catalog when considering only the in-ecliptic ICMEs.
The contribution from each spacecraft is detailed in Table A.3. The second column details the contribution of the spacecraft to the entire ICME catalog. On the hand, the third column shows the contribution to the in-ecliptic ICME catalog.
Percentage of contribution from each spacecraft to the catalog. The second column shows the contribution to the entire catalog, and the third column shows the contribution to the entire catalog when considering only the in-ecliptic ICMEs.
The ICME signatures used for detection in the individual catalogs are very similar for all the catalogs. The only catalogs that do not consider the sheaths are catalog #10 and #13, as explained below. The complete catalog obtained from this research can be found in this https://edatos.consorciomadrono.es/dataset.xhtml?persistentId=doi:10.21950/XGUIYX.
Appendix B: Literature review from previous authors
B.1. Size evolution with heliocentric distance
The power law fitting parameters of the size obtained from previous authors are detailed in Table B.1. Chen (1996) (R1) obtained the fitting parameters from theoretical calculations between 0.3 and 5 AU, while Kumar & Rust (1996) (R2) provided the size of ICMEs between and 0.3 and 4 AU by comparing with observations. Bothmer & Schwenn (1998) (R3), using magnetic clouds detected by Helios 1 and 2, estimated their size within the range between 0.3 and 4.2 AU. Wang et al. (2005) (R4) and Liu et al. (2005) (R5) complemented the analysis of the magnetic clouds with ICMEs measured by Ulysses and ACE in both cases. Liu et al. (2005) (R5) also added ICMEs measured from Wind, while Wang et al. (2005) (R4) added others from Pioneer Venus Orbiter (PVO). In both cases, the distance range was extended to 5.4 AU. Leitner et al. (2007) (R6.1) extended the distance range even more to 10 AU, thanks to the measurements from Pioneer 10 and 11 and Voyager 1 and 2. They also estimated the size of the inner heliosphere using measurements from Helios and Wind (R6.2). Gulisano et al. (2010) estimated the size of magnetic clouds in the inner heliosphere (between 0.3 and 1 AU) measured by Helios (R7.1), separating them between those that have not been affected by other ICMEs or a fast stream from a coronal hole, known as non-perturbed MC (R7.2), and those that have been affected, known as perturbed magnetic obstacles (R7.3). Gulisano et al. (2012), following the research from previous work, analyzed the size in the outer heliosphere (between 1.4 and 5.4 AU) using measurements from Ulysses for the entire dataset of magnetic clouds (R8.1), non-perturbed magnetic clouds (R8.2), and perturbed magnetic clouds (R8.3). Finally, Temmer & Bothmer (2022) obtained the size of the MO (R9.1) and sheaths (R9.2) in the inner heliosphere (between 0.3 and 1 AU) using measurements from Helios and the Parker Solar Probe.
Overview of the power law size fitting from previous authors. The references are detailed in the text.
B.2. Density evolution with heliocentric distance
The summary of the density power law fitting parameters is detailed in Table B.2. Kilpua et al. (2017) (R10), from measurements of Helios 1 and 2, Wind, ACE Ulysses, and Voyager, extended the power law fitting until 12 AU. As detailed in the previous section, R8.1, R8.2, and R8.3 refer to the estimation of the density using all the magnetic clouds, only the non-perturbed magnetic clouds, and the perturbed magnetic clouds, respectively, from Gulisano et al. (2012), while R9.1 and R9.2 refer to the density of the magnetic ejecta and sheaths, respectively, from Temmer & Bothmer (2022).
B.3. Evolution with solar cycle
Regarding the evolution with the solar cycle, Mitsakou & Moussas (2014), from the analysis of 325 ICMEs with sheaths obtained from a dataset of the OMNI near-Earth database and defined by their in situ plasma signatures during SC23 (between 1996 and 2008), obtained the average values of different magnitudes. These values are detailed in Table B.3, where the first row shows the results for the sheath and the second for the ejecta.
Overview of the power law density fitting from previous authors. The references are detailed in the text.
Average values from Mitsakou & Moussas (2014) of the sheath (firsr row) and ejecta (second row).
(Gopalswamy et al. 2015) analyzed sheaths and magnetic clouds from SC23 and part of SC24 (between May 1996 to December 2014) from in situ measurements at the L1 point. The results are detailed in Table B.4, where the first block reports the values for the sheaths and the second block shows those for the magnetic clouds.
Average values from Gopalswamy et al. (2015) of the sheath (first block) and magnetic clouds (second block).
Another study shows the results of Yermolaev et al. (2021). Through the analysis of OMNI data from SC21 to SC24, Yermolaev et al. (2021) obtained the average value of the characteristic magnitudes of the solar wind, sheath, and ejecta during these cycles (Table B.5).
Average values from Yermolaev et al. (2021) of the sheath (first block) and ejecta (second block).
All Tables
Percentage distribution (%) of ICME distribution for each solar cycle and distance.
Power law size fitting parameters (S = δ ⋅ rβ) for each structure and heliocentric distance.
Power law density fitting parameters (N = δ ⋅ rβ) for each structure and heliocentric distance.
Average sheath values according to the different solar cycles and heliocentric distance.
Average MO Cat I values according to the different solar cycles and heliocentric distance.
Average MO Cat II values according to the different solar cycles and heliocentric distance.
Correlation coefficients between the physical magnitudes of the sheath and MO Cat I.
Percentage of contribution from the individual catalogs. The second column shows the contribution to the entire catalog, and third column shows the contribution to the entire catalog when considering only the in-ecliptic ICMEs.
Percentage of contribution from each spacecraft to the catalog. The second column shows the contribution to the entire catalog, and the third column shows the contribution to the entire catalog when considering only the in-ecliptic ICMEs.
Overview of the power law size fitting from previous authors. The references are detailed in the text.
Overview of the power law density fitting from previous authors. The references are detailed in the text.
Average values from Mitsakou & Moussas (2014) of the sheath (firsr row) and ejecta (second row).
Average values from Gopalswamy et al. (2015) of the sheath (first block) and magnetic clouds (second block).
Average values from Yermolaev et al. (2021) of the sheath (first block) and ejecta (second block).
All Figures
|
Fig. 1. Definition of ICME structures and ambient solar wind upstream of the ICME. |
| In the text | |
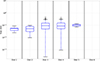 |
Fig. 2. Sheath size boxplots for the different distance intervals detailed in Table 3. |
| In the text | |
|
Fig. 3. Size boxplots of MO Cat I (black) and MO Cat II (green) for the different distance intervals detailed in Table 3. |
| In the text | |
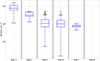 |
Fig. 4. Sheath density boxplots for the different distance intervals detailed in Table 3. |
| In the text | |
|
Fig. 5. Density boxplots of MO Cat I (black) and MO Cat II (green) for different distance intervals (detailed in Table 3). |
| In the text | |
|
Fig. 6. Definition of upstream solar wind windows under investigation. |
| In the text | |
|
Fig. 7. Density ratio between the sheath and upstream solar wind according to the time windows given in Fig. 6. Each numbered block refers to a distance interval, as detailed in the text. Each box represents the result averaged over the 12-h time window. |
| In the text | |
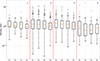 |
Fig. 8. Same as Fig. 7 but for the density ratio between MO Cat II and the upstream solar wind. |
| In the text | |
|
Fig. 9. Inner heliosphere yearly average values. The vertical color bands (blue, green, and yellow) represent SC23, 24, and part of SC25, respectively. From top to bottom, sunspot number (SSN), number of events (#), magnetic field (B), speed (v), density (N), and size (S). The red line is the SSN, while the blue, black, and green lines are the data for the sheaths, MO Cat I, and MO Cat II, respectively. The orange dashed line is the upstream solar wind yearly values. Since the number of sheaths and MO Cat I are the same, the second panel shows only the number of sheaths (blue line). |
| In the text | |
|
Fig. 10. Outer heliosphere yearly average values. The vertical color bands (blue, green, and yellow) represent SC23, 24, and part of SC25, respectively. From top to bottom, sunspot number (SSN), number of events (#), magnetic field (B), speed (v), density (N), and size (S). The red line is the SSN, while the blue, black, and green lines are the data for the sheaths, MO Cat I, and MO Cat II, respectively. The orange dashed line is the upstream solar wind yearly values. Since the number of sheaths and MO Cat I are the same, the second panel shows only the number of sheaths (blue line). |
| In the text | |
|
Fig. 11. Speed ratio between MO Cat I and the sheath for different distance intervals. |
| In the text | |
|
Fig. 12. Size ratio between MO Cat I and the sheath for different distance intervals. The blue dashed lines are the size ratio for the propagation and expansion type mechanisms according to Salman et al. (2021). |
| In the text | |
Current usage metrics show cumulative count of Article Views (full-text article views including HTML views, PDF and ePub downloads, according to the available data) and Abstracts Views on Vision4Press platform.
Data correspond to usage on the plateform after 2015. The current usage metrics is available 48-96 hours after online publication and is updated daily on week days.
Initial download of the metrics may take a while.