Fig. 10.
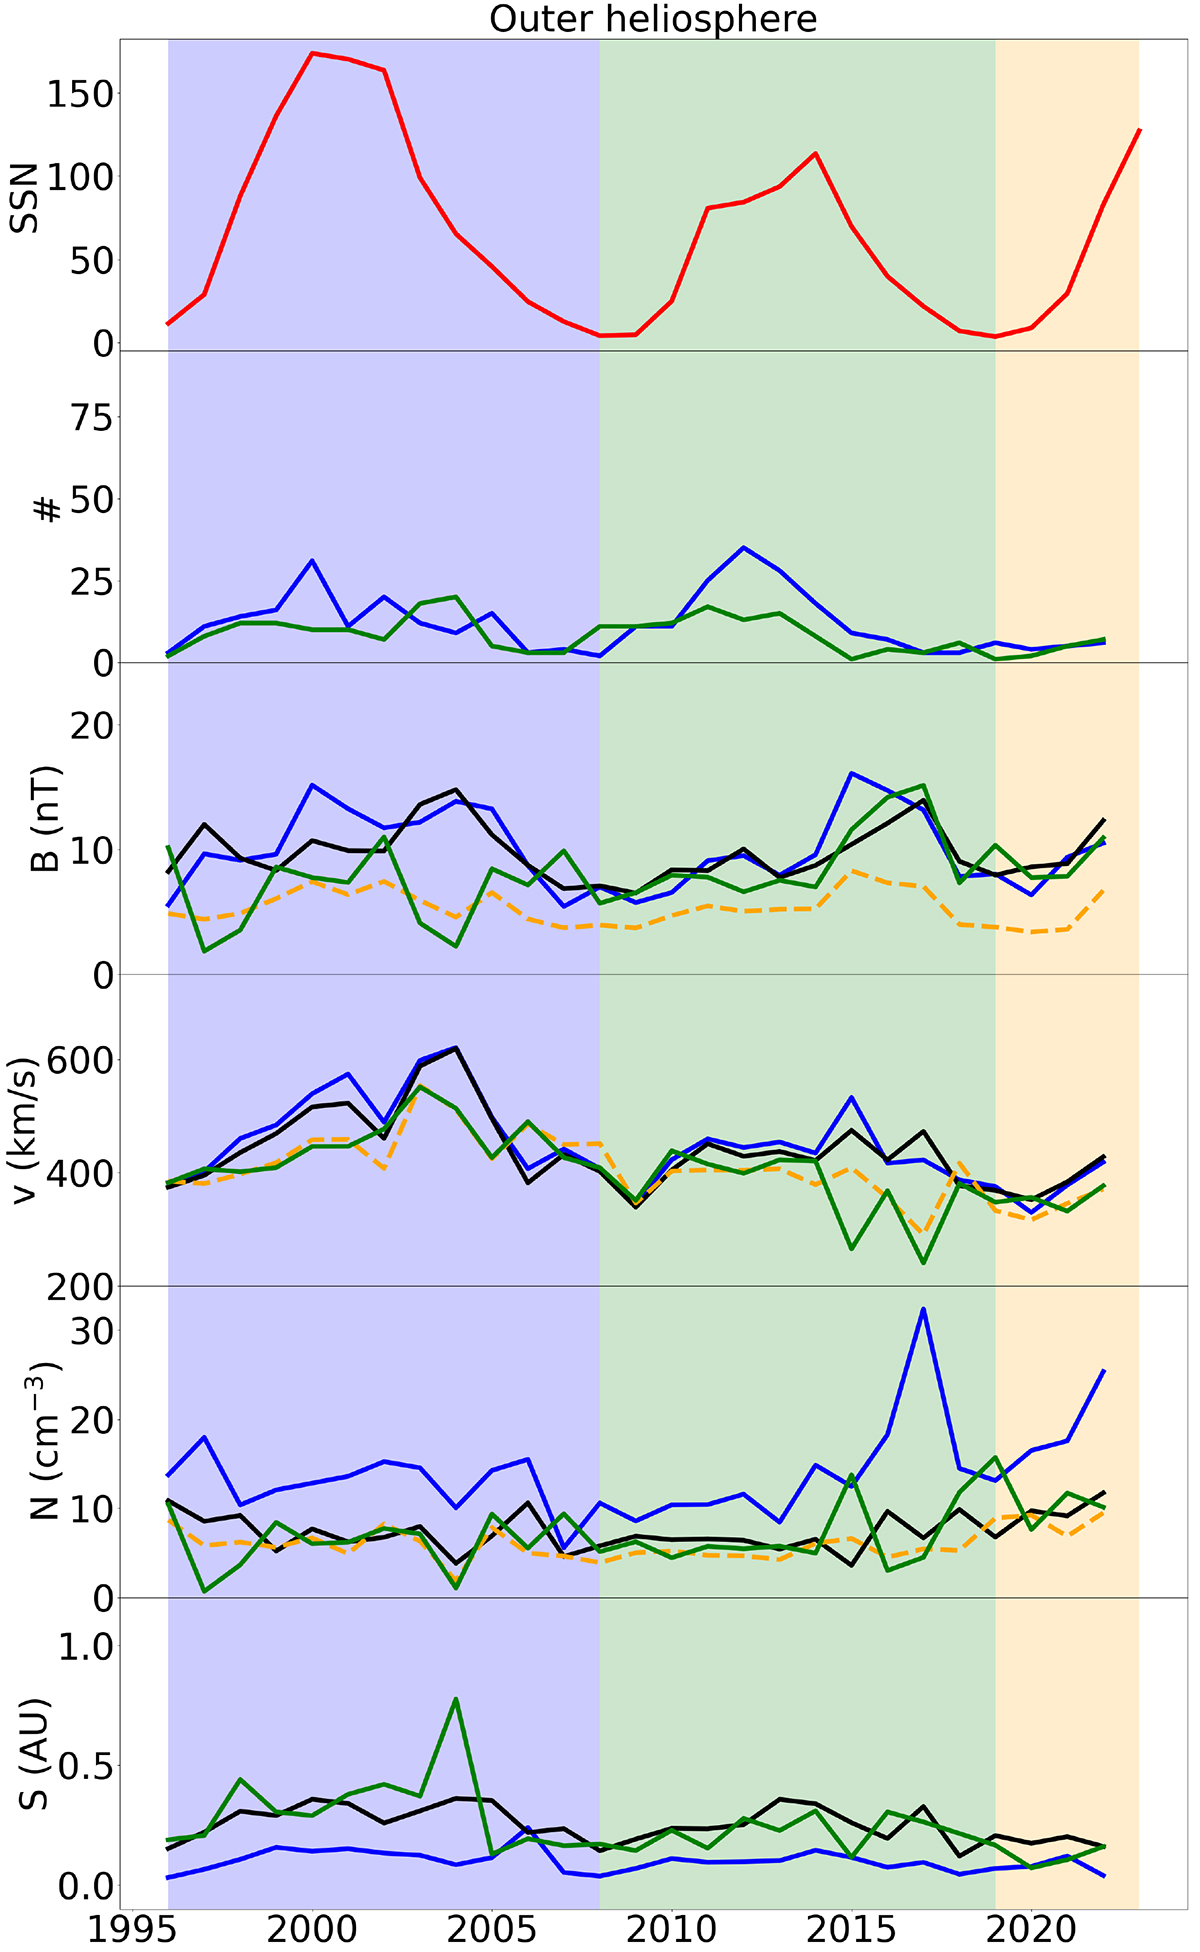
Download original image
Outer heliosphere yearly average values. The vertical color bands (blue, green, and yellow) represent SC23, 24, and part of SC25, respectively. From top to bottom, sunspot number (SSN), number of events (#), magnetic field (B), speed (v), density (N), and size (S). The red line is the SSN, while the blue, black, and green lines are the data for the sheaths, MO Cat I, and MO Cat II, respectively. The orange dashed line is the upstream solar wind yearly values. Since the number of sheaths and MO Cat I are the same, the second panel shows only the number of sheaths (blue line).
Current usage metrics show cumulative count of Article Views (full-text article views including HTML views, PDF and ePub downloads, according to the available data) and Abstracts Views on Vision4Press platform.
Data correspond to usage on the plateform after 2015. The current usage metrics is available 48-96 hours after online publication and is updated daily on week days.
Initial download of the metrics may take a while.