Fig. 9.
Download original image
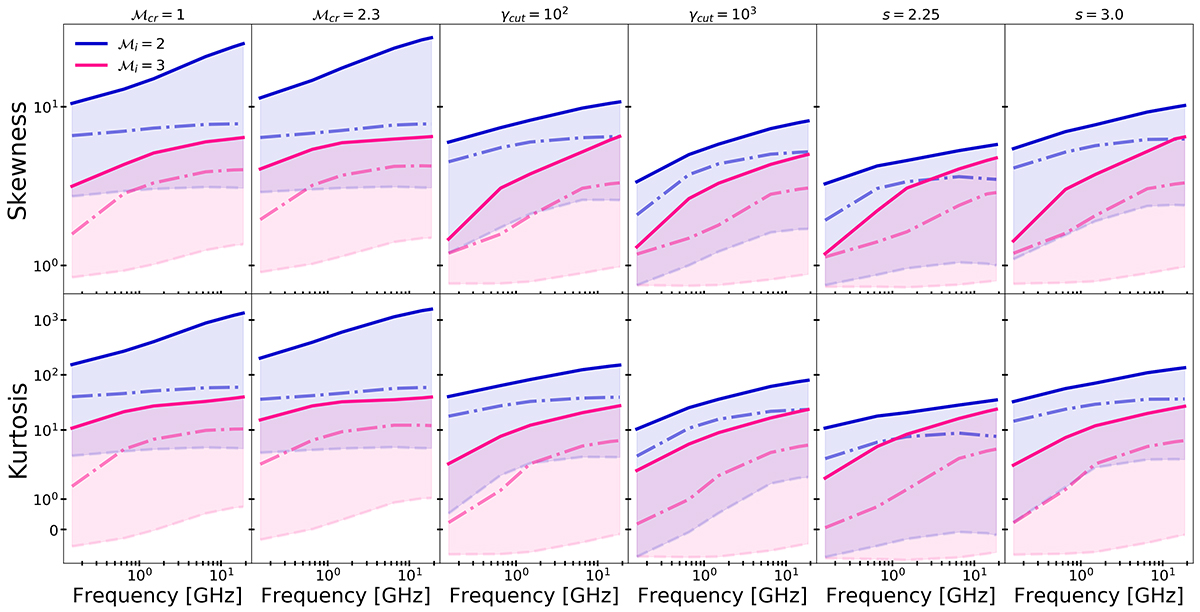
Skewness (upper row) and kurtosis (lower row) of the δSν/distribution for all our models at all frequencies. We only show the ℳi = 2 and ℳi = 3 cases. The upper solid lines correspond to the unsmoothed data and the dot-dashed and dashed lines correspond to the data smoothed with the 5″ × 5″ and 20″ × 20″ beam sizes, respectively.
Current usage metrics show cumulative count of Article Views (full-text article views including HTML views, PDF and ePub downloads, according to the available data) and Abstracts Views on Vision4Press platform.
Data correspond to usage on the plateform after 2015. The current usage metrics is available 48-96 hours after online publication and is updated daily on week days.
Initial download of the metrics may take a while.