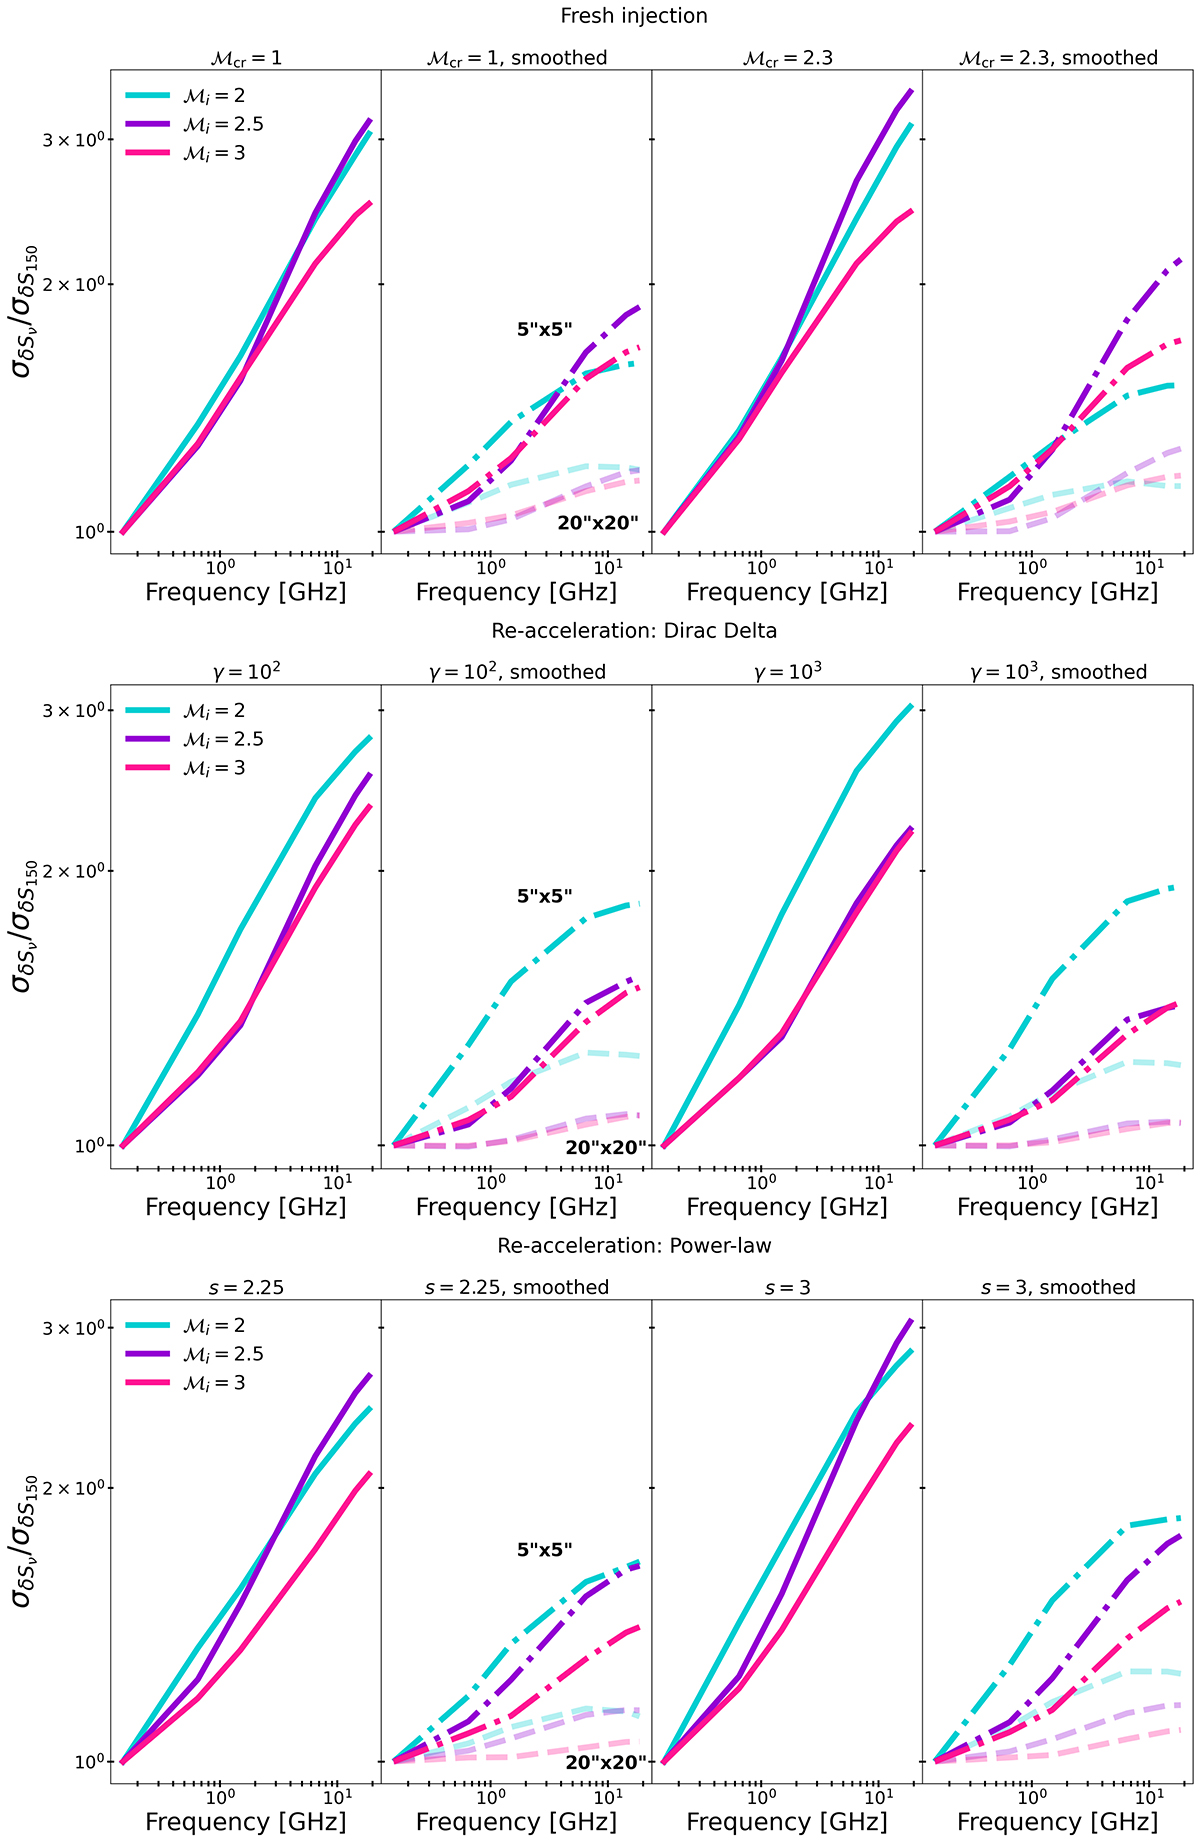
Fig. 8.
Download original image
Standard deviation of the δSν distribution normalized by that at 150 MHz at the shock-front at 184.7 Myr for all our models at all frequencies. The top, middle and bottom rows correspond to the fresh injection model, the re-acceleration model assuming a Dirac Delta pre-existing distribution function and the re-acceleration model assuming a power-law pre-existing distribution function, respectively. The first and third columns show the results from the original maps and the second and fourth columns show the results of the map smoothed with 5″ × 5″ (dot-dashed) and 20″ × 20″ (dashed) beam sizes.
Current usage metrics show cumulative count of Article Views (full-text article views including HTML views, PDF and ePub downloads, according to the available data) and Abstracts Views on Vision4Press platform.
Data correspond to usage on the plateform after 2015. The current usage metrics is available 48-96 hours after online publication and is updated daily on week days.
Initial download of the metrics may take a while.