Fig. 6.
Download original image
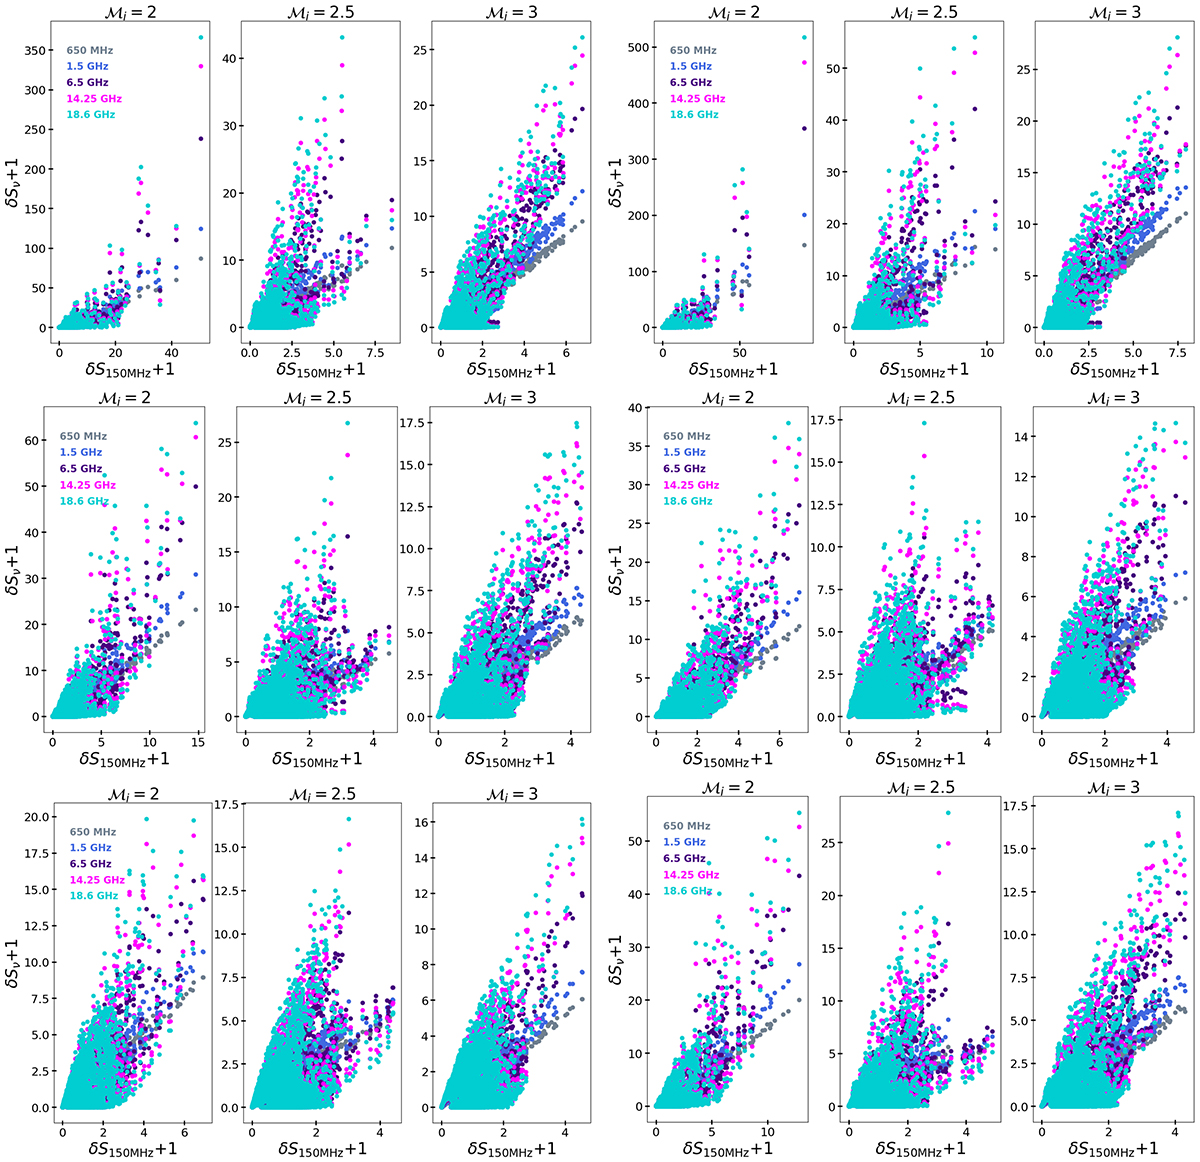
Phase plots of the ![]() distribution at t = 184.7 Myr for all our models at all frequencies versus the same distribution but at 150 MHz. The top, middle and bottom rows correspond to the fresh injection model, the re-acceleration model assuming a Dirac Delta pre-existing distribution function and the re-acceleration model assuming a power-law pre-existing distribution function, respectively. The differences between the columns correspond to the different parameters studied first (second) column correspond to ℳcr = 1 (ℳcr = 2.3), γcut = 102 (γcut = 103) and s = 2.25 (s = 3) in the first, second and third rows, correspondingly.
distribution at t = 184.7 Myr for all our models at all frequencies versus the same distribution but at 150 MHz. The top, middle and bottom rows correspond to the fresh injection model, the re-acceleration model assuming a Dirac Delta pre-existing distribution function and the re-acceleration model assuming a power-law pre-existing distribution function, respectively. The differences between the columns correspond to the different parameters studied first (second) column correspond to ℳcr = 1 (ℳcr = 2.3), γcut = 102 (γcut = 103) and s = 2.25 (s = 3) in the first, second and third rows, correspondingly.
Current usage metrics show cumulative count of Article Views (full-text article views including HTML views, PDF and ePub downloads, according to the available data) and Abstracts Views on Vision4Press platform.
Data correspond to usage on the plateform after 2015. The current usage metrics is available 48-96 hours after online publication and is updated daily on week days.
Initial download of the metrics may take a while.