Fig. 5.
Download original image
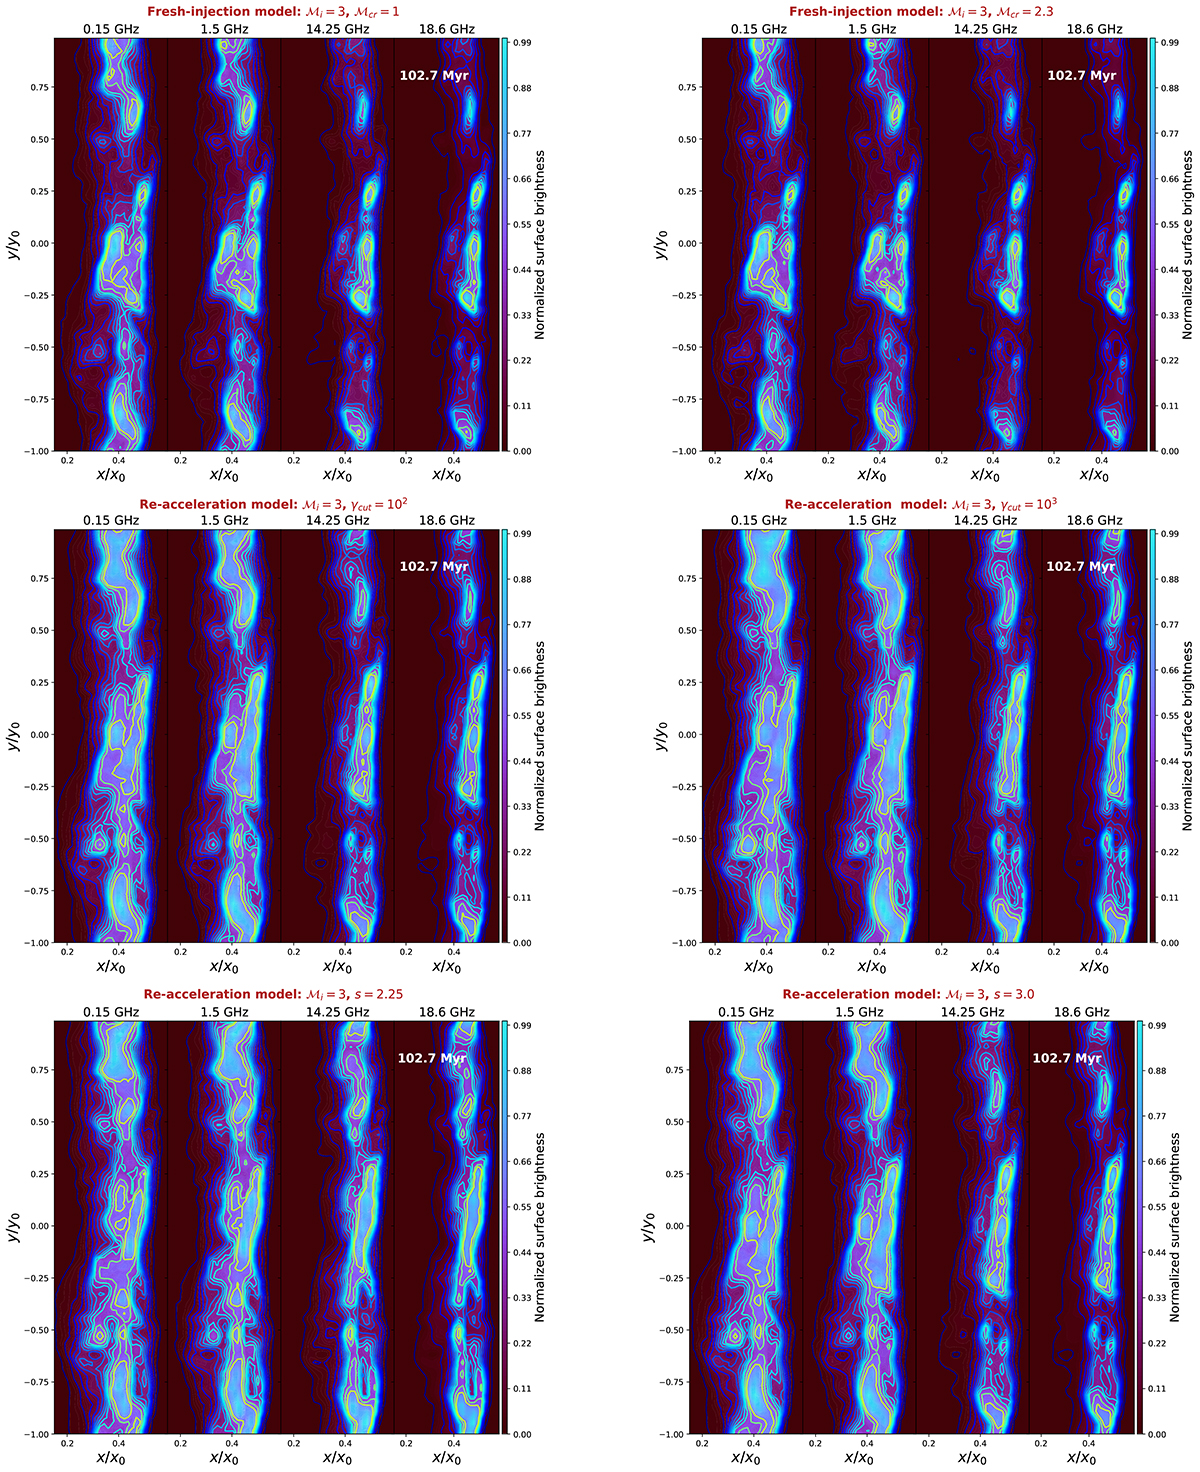
Normalized surface brightness maps of the shock front for the ℳi = 3 case in the fresh-injection model (first row) and re-acceleration model with a Dirac Delta (second row) and a power-law (third row) fossil populations. Each sub-panel shows four different frequencies, namely 150 MHz, 1.5 GHz, 14.25 GHz, and 18.6 GHz. The first (last) four columns correspond to ℳcr = 1 (ℳcr = 2.3), γcut = 102 (γcut = 103), and s = 2.25 (s = 3), respectively. The time-step selected of the simulation is 120.7 Myr (see the top corner of each sub-panel).
Current usage metrics show cumulative count of Article Views (full-text article views including HTML views, PDF and ePub downloads, according to the available data) and Abstracts Views on Vision4Press platform.
Data correspond to usage on the plateform after 2015. The current usage metrics is available 48-96 hours after online publication and is updated daily on week days.
Initial download of the metrics may take a while.