Fig. 4.
Download original image
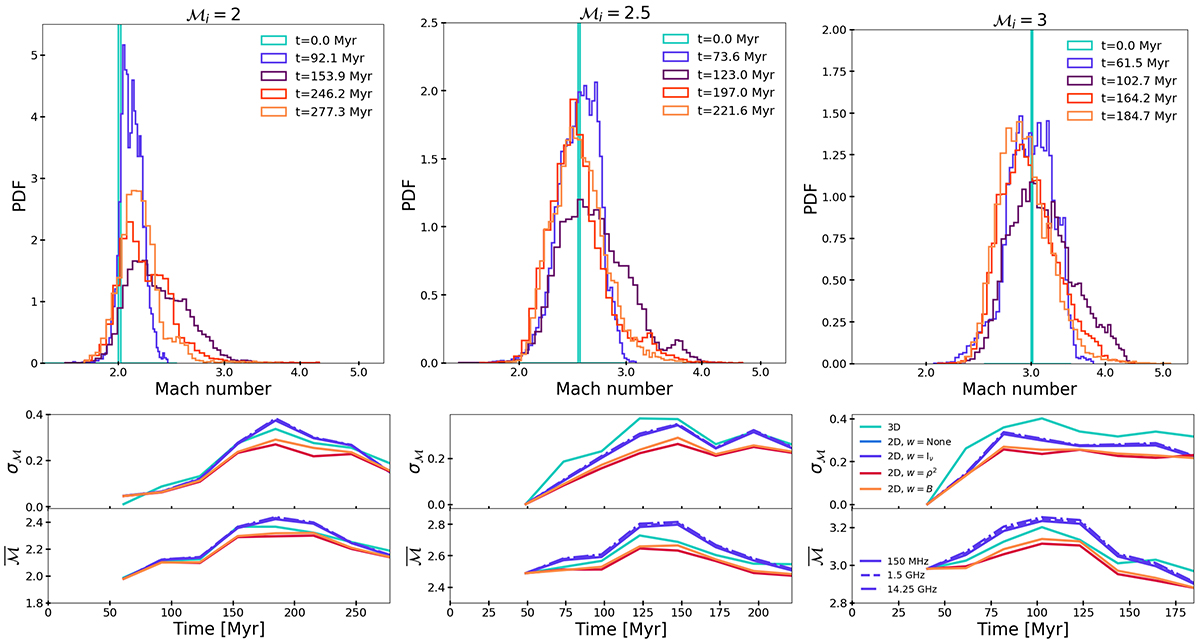
3D Mach number distribution at the shock cells at selected simulation times (top). Standard deviation of the Mach number PDF as function of time (bottom). Each column corresponds to the different initial Mach number of the shock. For the 2D Mach number distribution we used different weights for the projection (see legend). Note: here, Iν is taken from the fresh-injection model (case ℳcr = 1; see Sect. 4.2). See Appendix C for a comparison between weights corresponding to the emission coming from the fresh-injection and re-acceleration models.
Current usage metrics show cumulative count of Article Views (full-text article views including HTML views, PDF and ePub downloads, according to the available data) and Abstracts Views on Vision4Press platform.
Data correspond to usage on the plateform after 2015. The current usage metrics is available 48-96 hours after online publication and is updated daily on week days.
Initial download of the metrics may take a while.