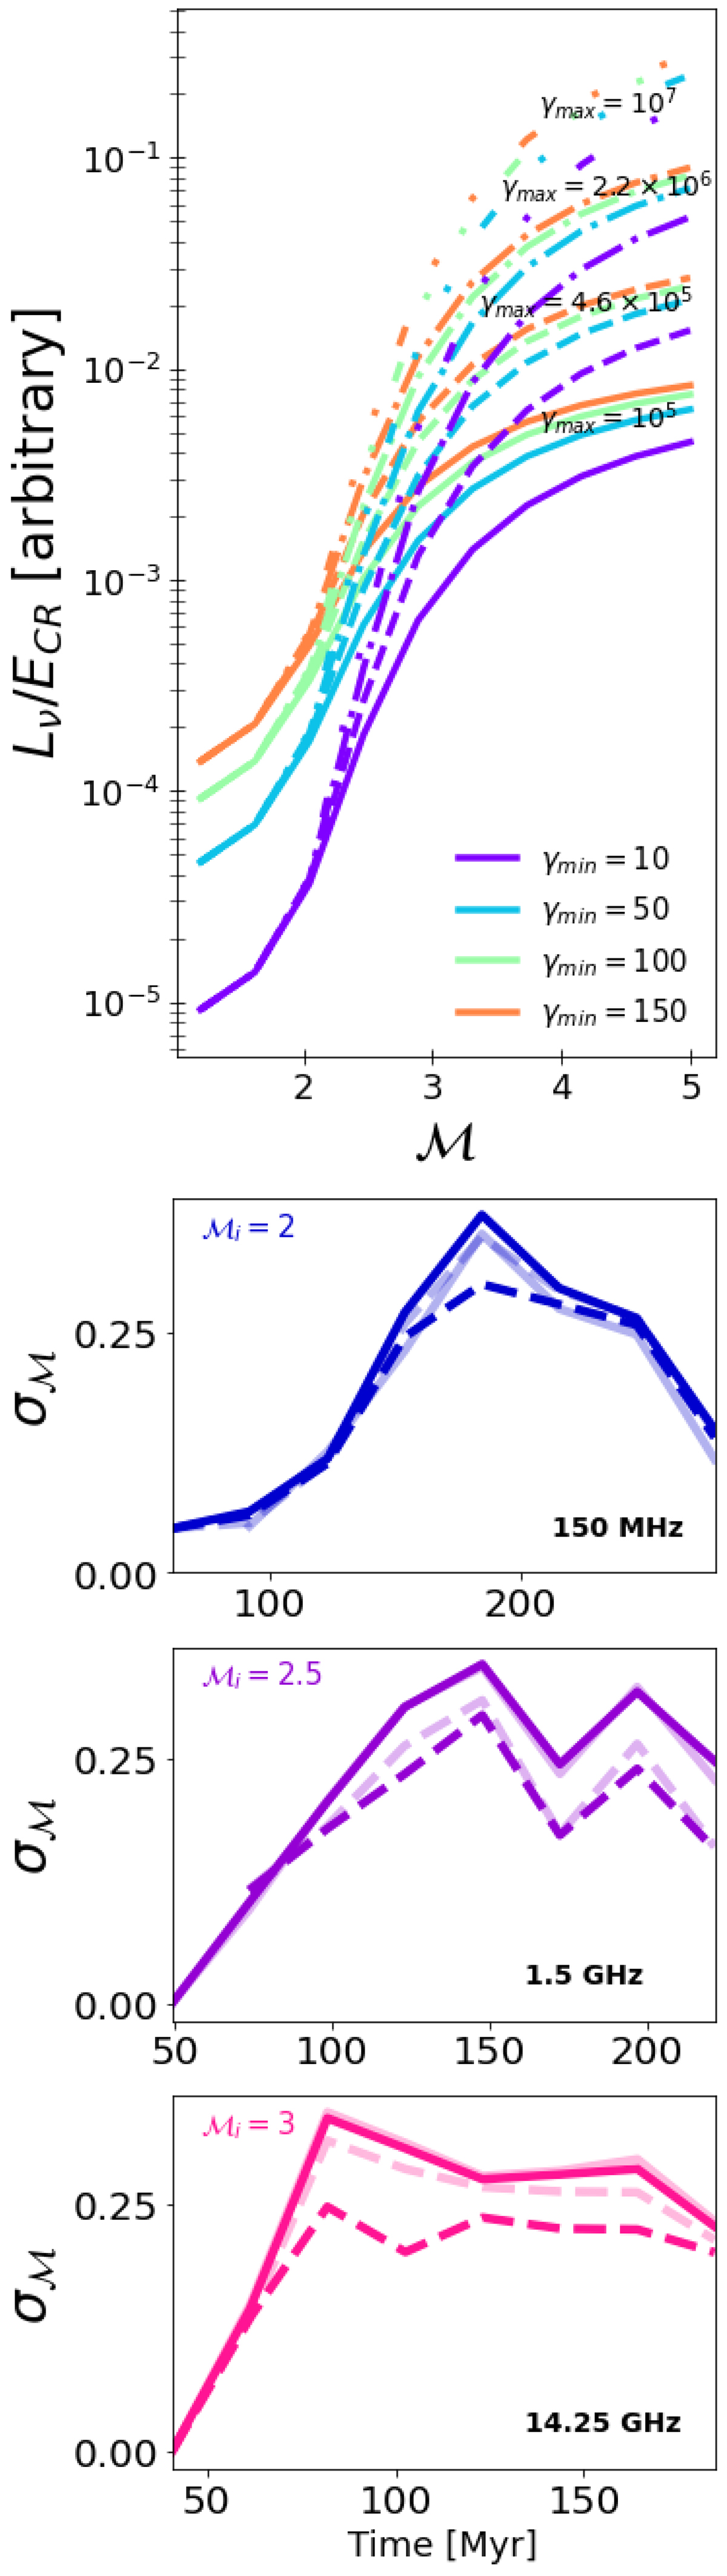
Fig. C.2.
Download original image
Ratio of synchrotron and CRe energies as function of the Mach number for different minimum and maximum energy limits (left). A magnetic field of 1 μG was assumed. The right panel shows the same as the bottom row in Fig. 4, but using as weight both the fresh-injection model (solid lines; ℳcr = 2.3 with higher transparency) and the re-acceleration model (dashed lines; s = 3 with higher transparency).
Current usage metrics show cumulative count of Article Views (full-text article views including HTML views, PDF and ePub downloads, according to the available data) and Abstracts Views on Vision4Press platform.
Data correspond to usage on the plateform after 2015. The current usage metrics is available 48-96 hours after online publication and is updated daily on week days.
Initial download of the metrics may take a while.