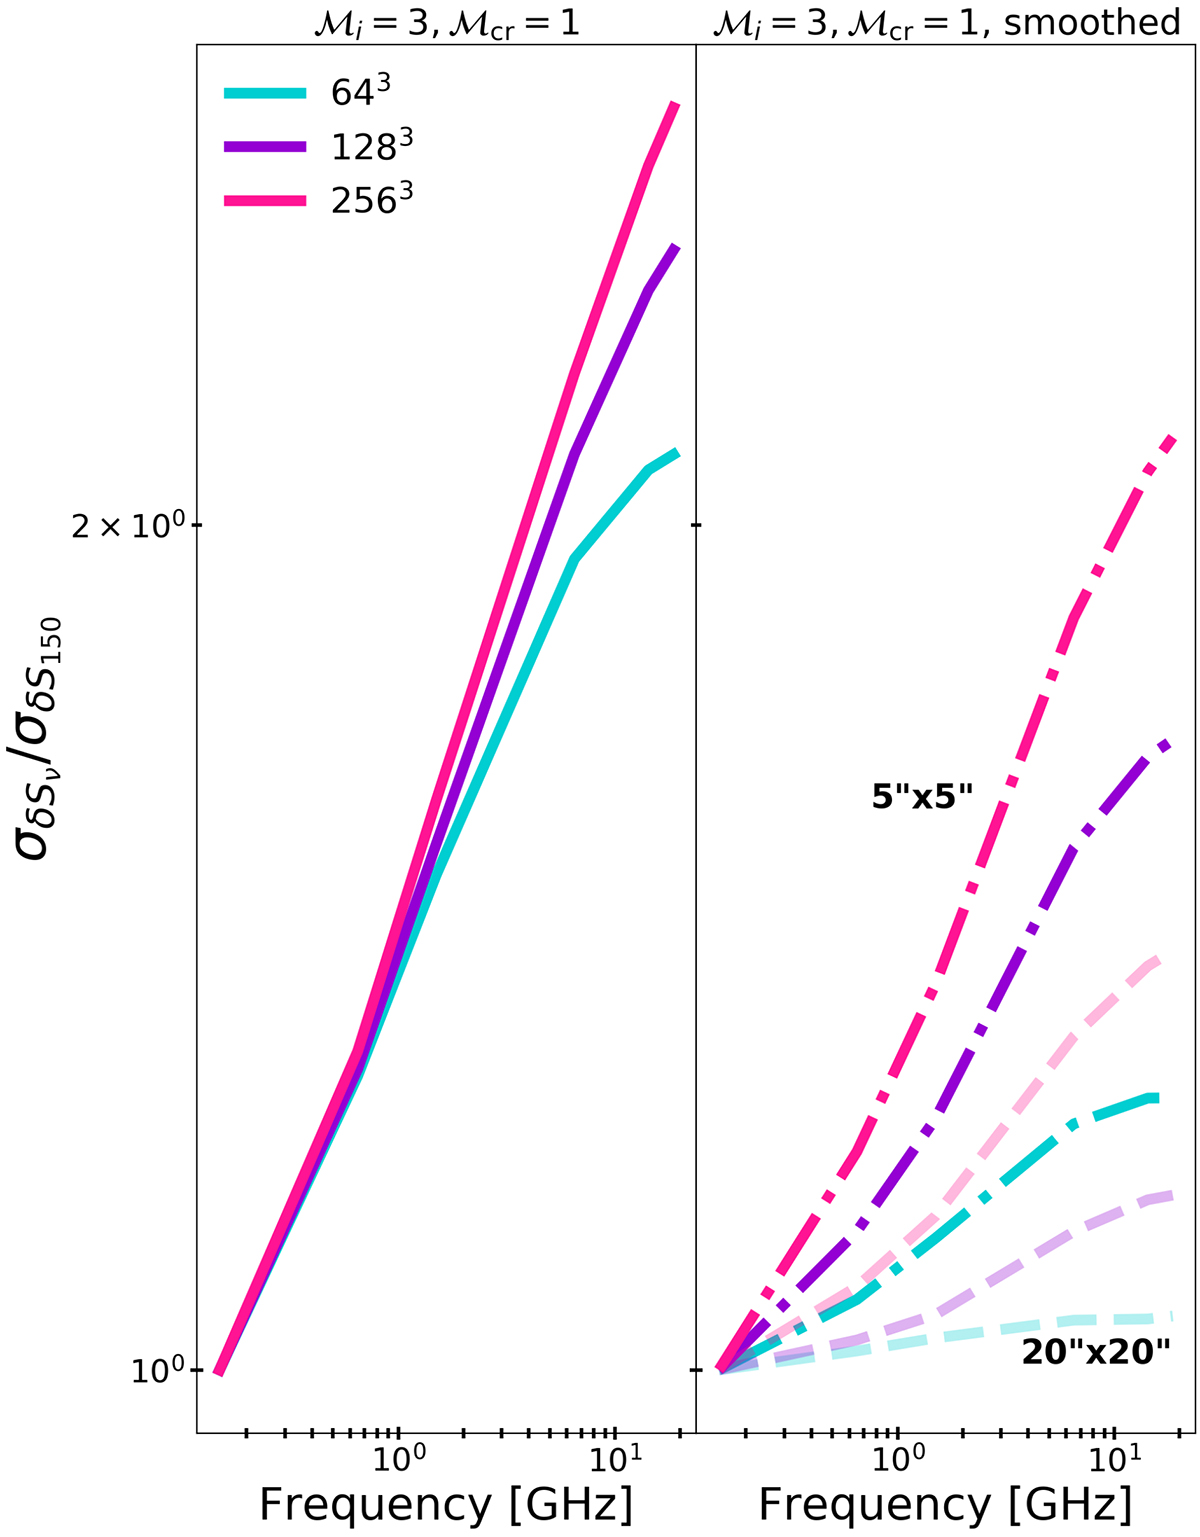
Fig. 10.
Download original image
Standard deviation of the δSν distribution normalized by that at 150 MHz at the shock-front for the ℳi = 3 case at all frequencies for the ℳcr = 1 fresh injection model at t = 187.4 Myr. We show the result for three different numerical resolutions. The first column shows the results from the original maps and the second column the results from the smoothed maps, similarly to Fig. 8.
Current usage metrics show cumulative count of Article Views (full-text article views including HTML views, PDF and ePub downloads, according to the available data) and Abstracts Views on Vision4Press platform.
Data correspond to usage on the plateform after 2015. The current usage metrics is available 48-96 hours after online publication and is updated daily on week days.
Initial download of the metrics may take a while.