Fig. 3.
Download original image
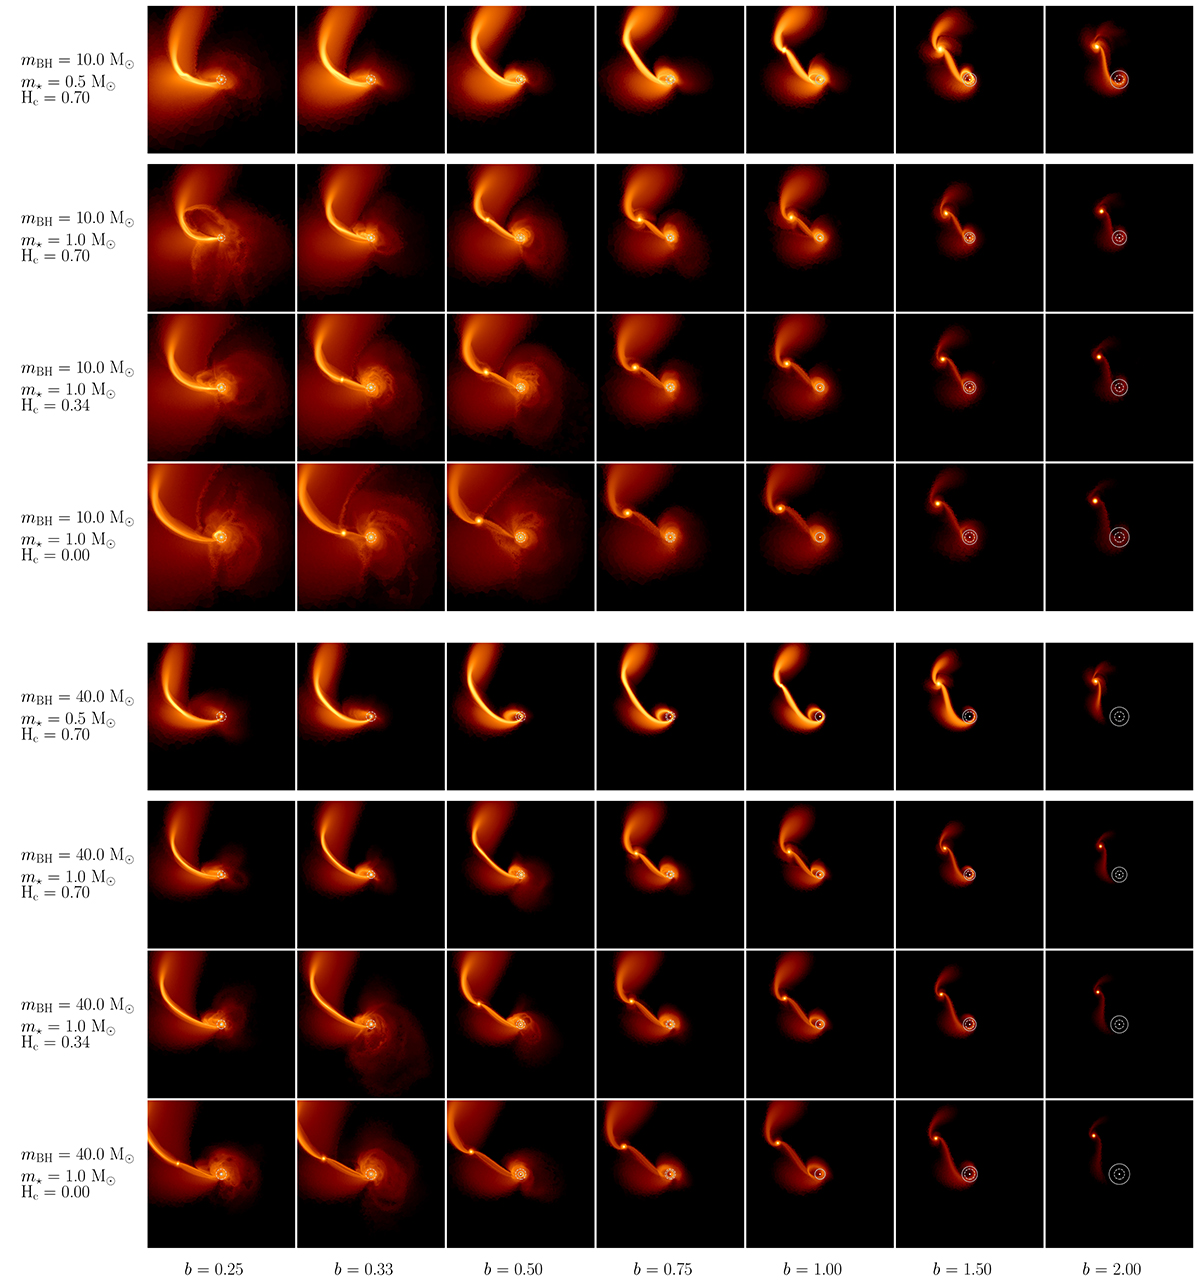
Grid of log density slices of stars of ∼20 tdyn, ⋆ after undergoing μTDEs, with the BH at the center of each panel. Each row is for a different mBH (top and bottom half for 10 M⊙ and 40 M⊙, respectively), m⋆, or Hc, whereas the columns represent increasing b (from left to right). The dashed and solid circles around the BH, most visible in the rightmost panels, denote the tidal radius, rt, and the periapsis distance, rp, respectively. We note that the spatial range of each panel is not the same.
Current usage metrics show cumulative count of Article Views (full-text article views including HTML views, PDF and ePub downloads, according to the available data) and Abstracts Views on Vision4Press platform.
Data correspond to usage on the plateform after 2015. The current usage metrics is available 48-96 hours after online publication and is updated daily on week days.
Initial download of the metrics may take a while.