Fig. 7
Download original image
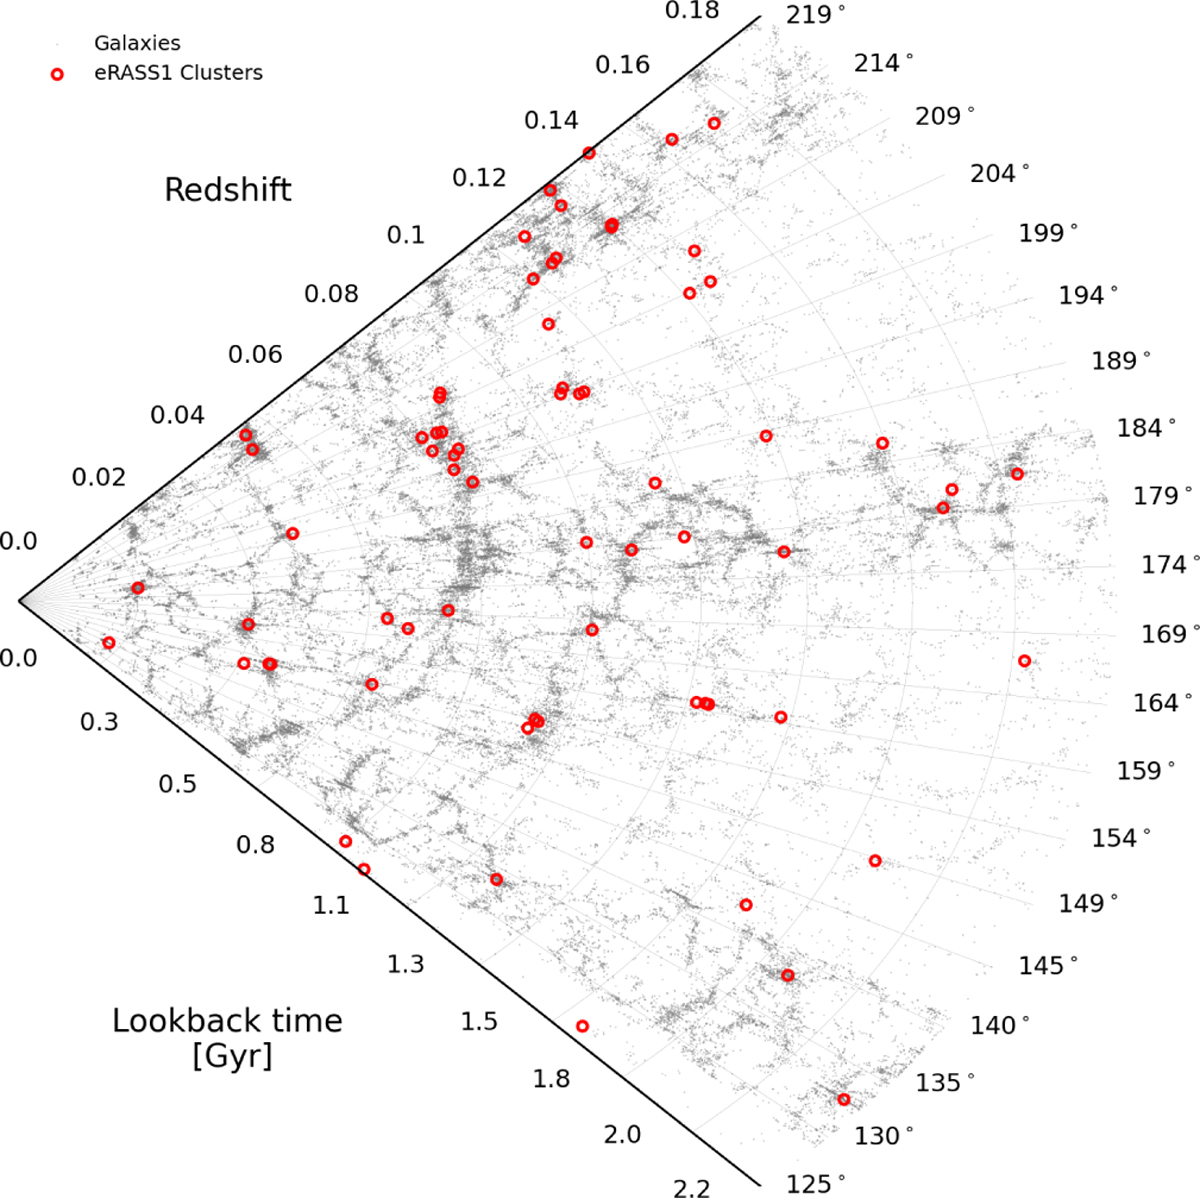
Distribution of nearby eRASS1 galaxy clusters along the equator (red circles) illustrating the large scale structures of the Universe. Positions are projected along declination (|Dec| < 2 deg) within redshift 0.2. Galaxies from the GAMA and SDSS survey are represented with grey dots (Driver et al. 2022; Almeida et al. 2023).
Current usage metrics show cumulative count of Article Views (full-text article views including HTML views, PDF and ePub downloads, according to the available data) and Abstracts Views on Vision4Press platform.
Data correspond to usage on the plateform after 2015. The current usage metrics is available 48-96 hours after online publication and is updated daily on week days.
Initial download of the metrics may take a while.