Fig. 4
Download original image
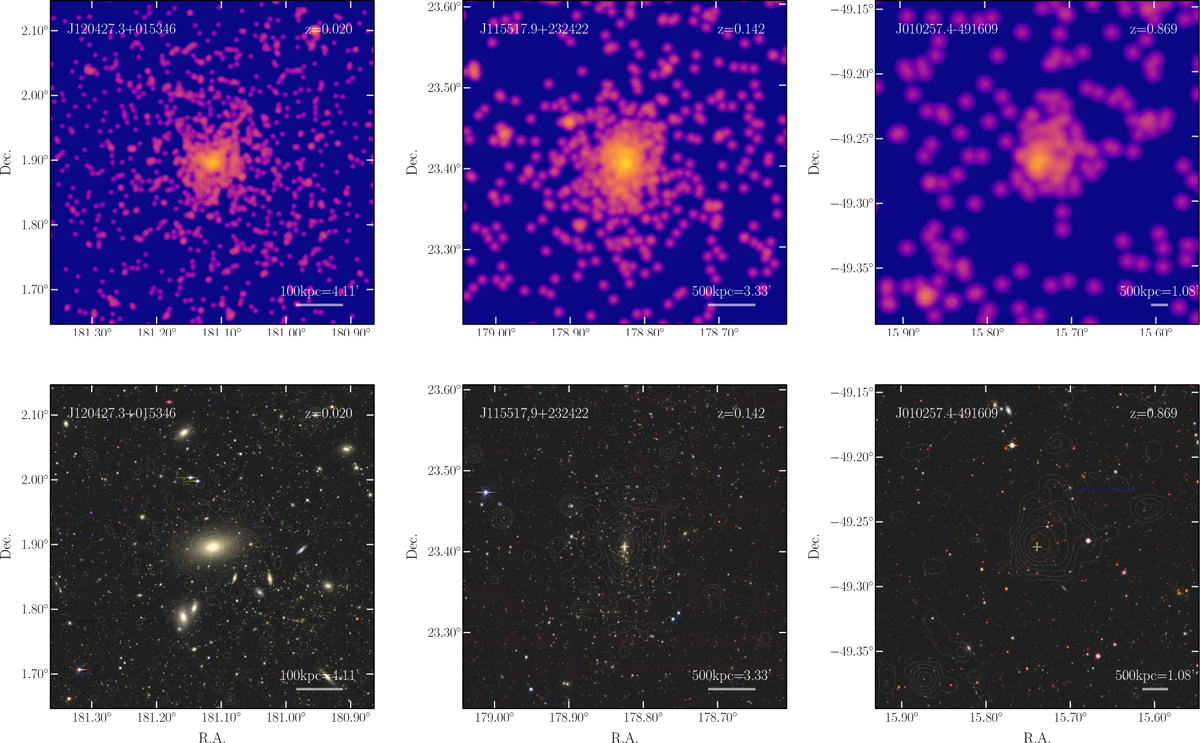
Examples of eRASS1 clusters. From left to right: 1eRASS J120427.3+015346 (MKW4) at z = 0.020, eRASS1 J115517.9+232422 at z = 0.142, and eRASS1 J010257.4-491609 (El Gordo) at z = 0.869. The upper panels show eRASS1 X-ray image in the 0.2–2.3 keV band, smoothed with a Gaussian of σ = 12″. LS DR10 grz images are shown in the lower panels, overlaid with X-ray contours.
Current usage metrics show cumulative count of Article Views (full-text article views including HTML views, PDF and ePub downloads, according to the available data) and Abstracts Views on Vision4Press platform.
Data correspond to usage on the plateform after 2015. The current usage metrics is available 48-96 hours after online publication and is updated daily on week days.
Initial download of the metrics may take a while.