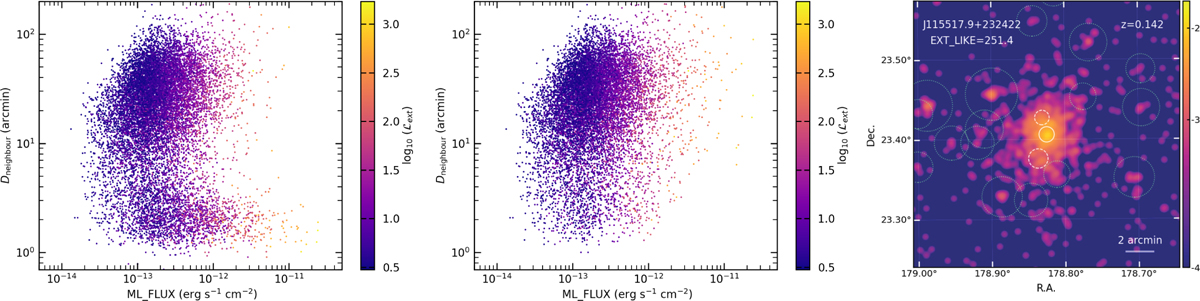
Fig. 3
Download original image
Distance to the closest neighbor for each source is plotted against its ML_FLUX, demonstrating the general properties of the split sources on the sample level before and after cleaning on the right and middle panels. The color code denotes the extent likelihood 𝓛ext. Note the removal of the sources in the lower right corner. On the right panel, the figure shows an example of the split sources (dashed white circles) in a nearby cluster 1eRASS J115517.9+232422 at the redshift of 0.14. After cleaning, the source center is shown in a solid white circle. The circles in green are the point sources detected by eROSITA in the field.
Current usage metrics show cumulative count of Article Views (full-text article views including HTML views, PDF and ePub downloads, according to the available data) and Abstracts Views on Vision4Press platform.
Data correspond to usage on the plateform after 2015. The current usage metrics is available 48-96 hours after online publication and is updated daily on week days.
Initial download of the metrics may take a while.