Fig. 2
Download original image
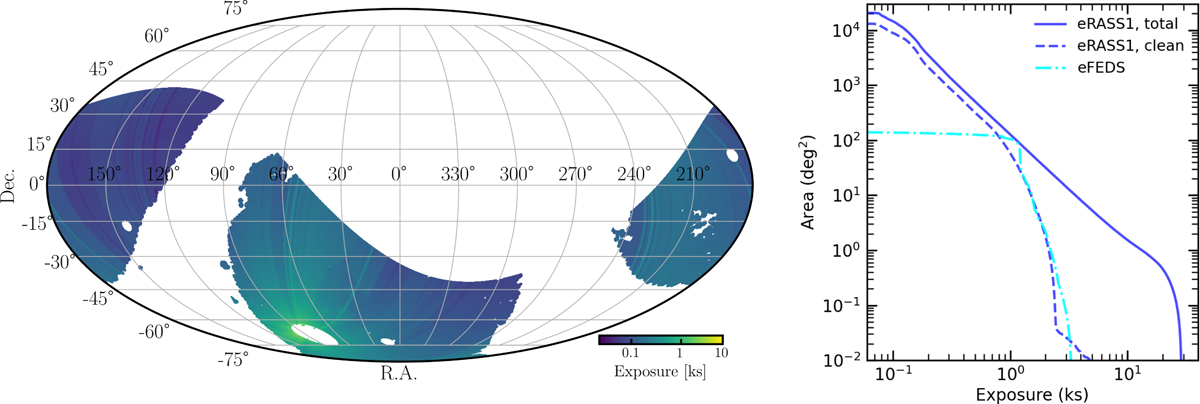
Survey area and exposure information of the eRASSl cluster catalog. Left panel: vignetted exposure map in the 0.2–2.3 keV band after masking regions. The clean exposure time changes from ∼0.1 ks to 1.2 ks in the survey. Right panel: cumulative eRASSl sky coverage as a function of exposure in the 0.2–2.3 keV band. Blue solid and dashed curves show the data before and after cleaning. The curve in cyan shows the depth of the eFEDS survey, as a comparison (Brunner et al. 2022).
Current usage metrics show cumulative count of Article Views (full-text article views including HTML views, PDF and ePub downloads, according to the available data) and Abstracts Views on Vision4Press platform.
Data correspond to usage on the plateform after 2015. The current usage metrics is available 48-96 hours after online publication and is updated daily on week days.
Initial download of the metrics may take a while.