Fig. 17
Download original image
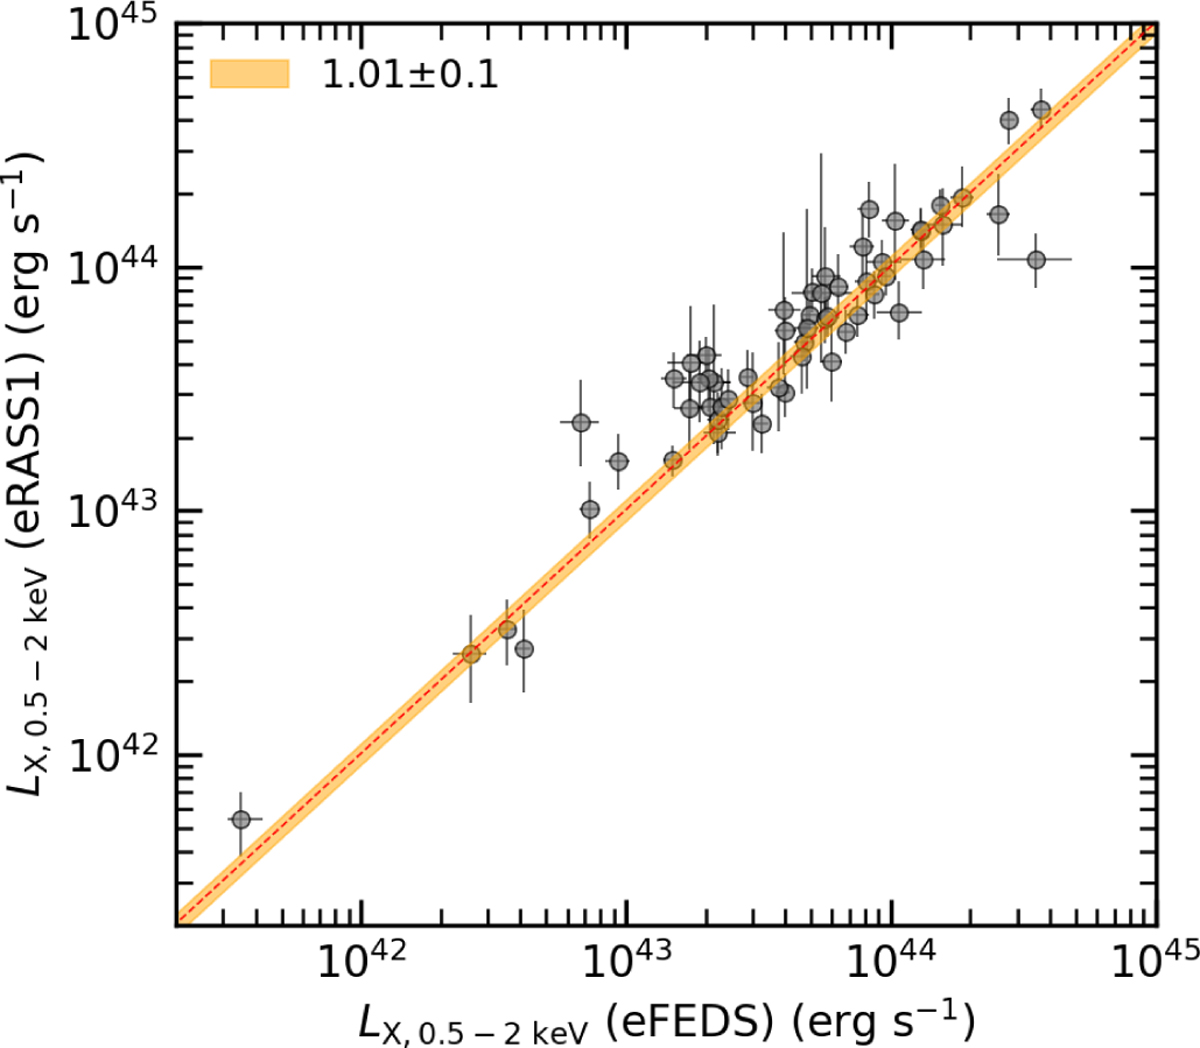
Comparison of the luminosities of the 62 matched clusters detected in eRASS1 and eFEDS. The luminosities are measured within the same radius of 300 kpc and the same energy band of 0.5–2.0 keV. The best-fit line with slope 1.01 ± 0.1 is overplotted in the orange-shaded region. The overall agreement between eFEDS and eRASS1 results is seen regardless of the depth difference between the two surveys.
Current usage metrics show cumulative count of Article Views (full-text article views including HTML views, PDF and ePub downloads, according to the available data) and Abstracts Views on Vision4Press platform.
Data correspond to usage on the plateform after 2015. The current usage metrics is available 48-96 hours after online publication and is updated daily on week days.
Initial download of the metrics may take a while.