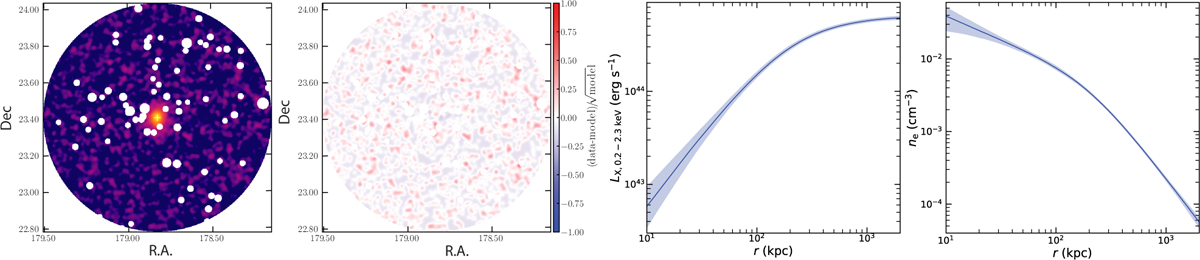
Fig. 11
Download original image
Example of MBProj2D analysis and results. The left panels show the 0.2–2.3 keV image of eRASS1 J115517.9+232422 and the residual image after MBProj2D fitting. Point and extended sources are masked from the image. The noise level in the residual image shows that the source emission is successfully modeled from the fitting process. The right panels are the luminosity profiles and electron density profiles.
Current usage metrics show cumulative count of Article Views (full-text article views including HTML views, PDF and ePub downloads, according to the available data) and Abstracts Views on Vision4Press platform.
Data correspond to usage on the plateform after 2015. The current usage metrics is available 48-96 hours after online publication and is updated daily on week days.
Initial download of the metrics may take a while.