Fig. 8
Download original image
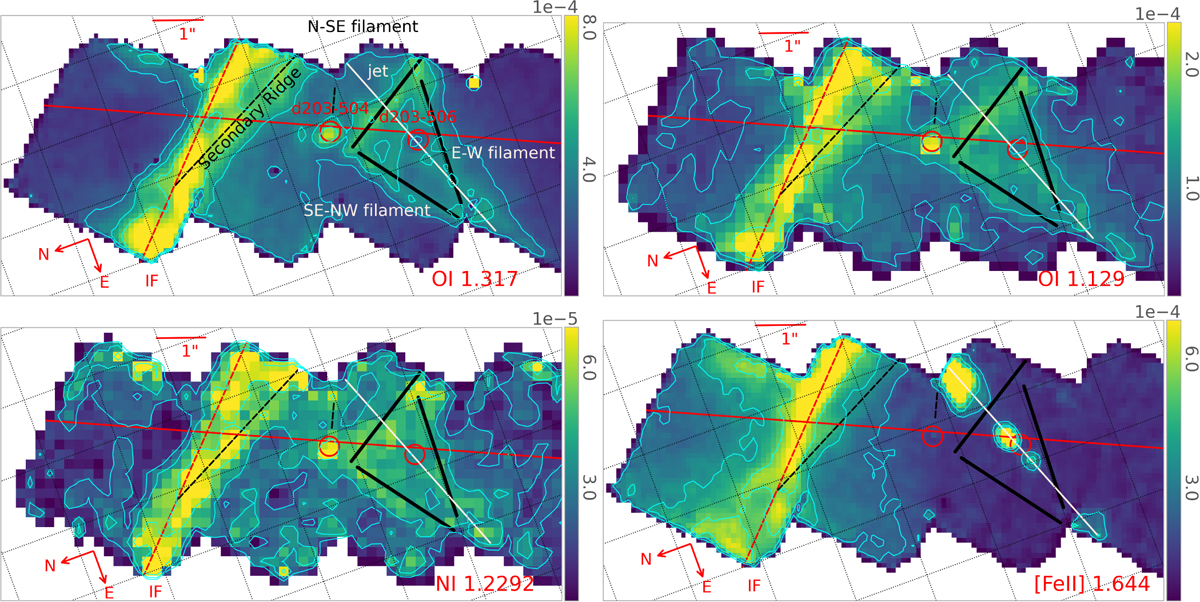
Maps of O I 1.317 µm, 1.129 µm (top) as well as N I 1.2292 µm and [Fe II] 1.644 µm (bottom) across part of the NIRSpec mosaic (see the O I 1.317 µm and [Fe II] 1.644 µm maps in Fig. 7 for the full mosaic). Similar filamentary structure beyond the IF is seen in the three fluorescent lines but not in the [Fe II] 1.644 µm line. We set the colour range from the bottom 0.5% to the top 99.5% intensity levels of the data for each map (across the entire NIRSpec mosaic), excluding values of zero, edge pixels, and the two proplyds. White pixels inside the mosaic indicate values of zero reflecting issues with the data. The nearly horizontal red line indicates the NIRSpec cut and the nearly vertical red line indicates the IF. The dashed black line crossing the IF indicates the secondary ridge. The two proplyds are indicated by the circles, the jet associated with proplyd 203–504 by a white solid line and the filaments by black lines. Contours show the 77.9, 90.2, and 96% intensity levels of the data for O I 1.317 µm, 70, 85, and 97% intensity levels for O I 1.129 µm and 55, 81, and 96% intensity levels for N I 1.2292 µm, and 80, 90.2, and 96% intensity levels of the data for [Fe II] 1.644 µm (across the entire NIRSpec mosaic).
Current usage metrics show cumulative count of Article Views (full-text article views including HTML views, PDF and ePub downloads, according to the available data) and Abstracts Views on Vision4Press platform.
Data correspond to usage on the plateform after 2015. The current usage metrics is available 48-96 hours after online publication and is updated daily on week days.
Initial download of the metrics may take a while.