Fig. C.1
Download original image
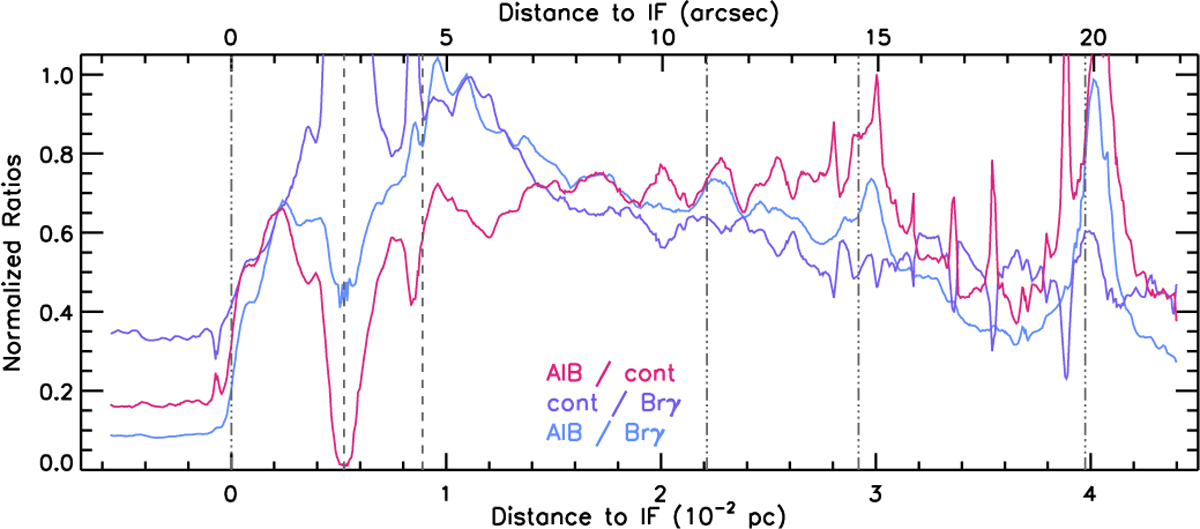
Normalised ratios of the 3 µm continuum emission, Brγ emission and total AIB emission as a function of distance to the IF (0.228 pc or 113.4″ from θ1 Ori C) along a cut crossing the NIRSpec mosaic (see Fig. 1). As the cut is not perpendicular to the IF and distances are given along the cut, a correction factor of cos(19.58°)=0.942 needs to be applied to obtain a perpendicular distance from the IF. No extinction correction is applied. The dash-dot-dot-dot vertical lines indicate the position of the IF, DF 1, DF 2, and DF 3, respectively, from left to right. The dashed vertical lines indicated the location of the proplyds 203-504 (left) and 203-506 (right).
Current usage metrics show cumulative count of Article Views (full-text article views including HTML views, PDF and ePub downloads, according to the available data) and Abstracts Views on Vision4Press platform.
Data correspond to usage on the plateform after 2015. The current usage metrics is available 48-96 hours after online publication and is updated daily on week days.
Initial download of the metrics may take a while.