Open Access
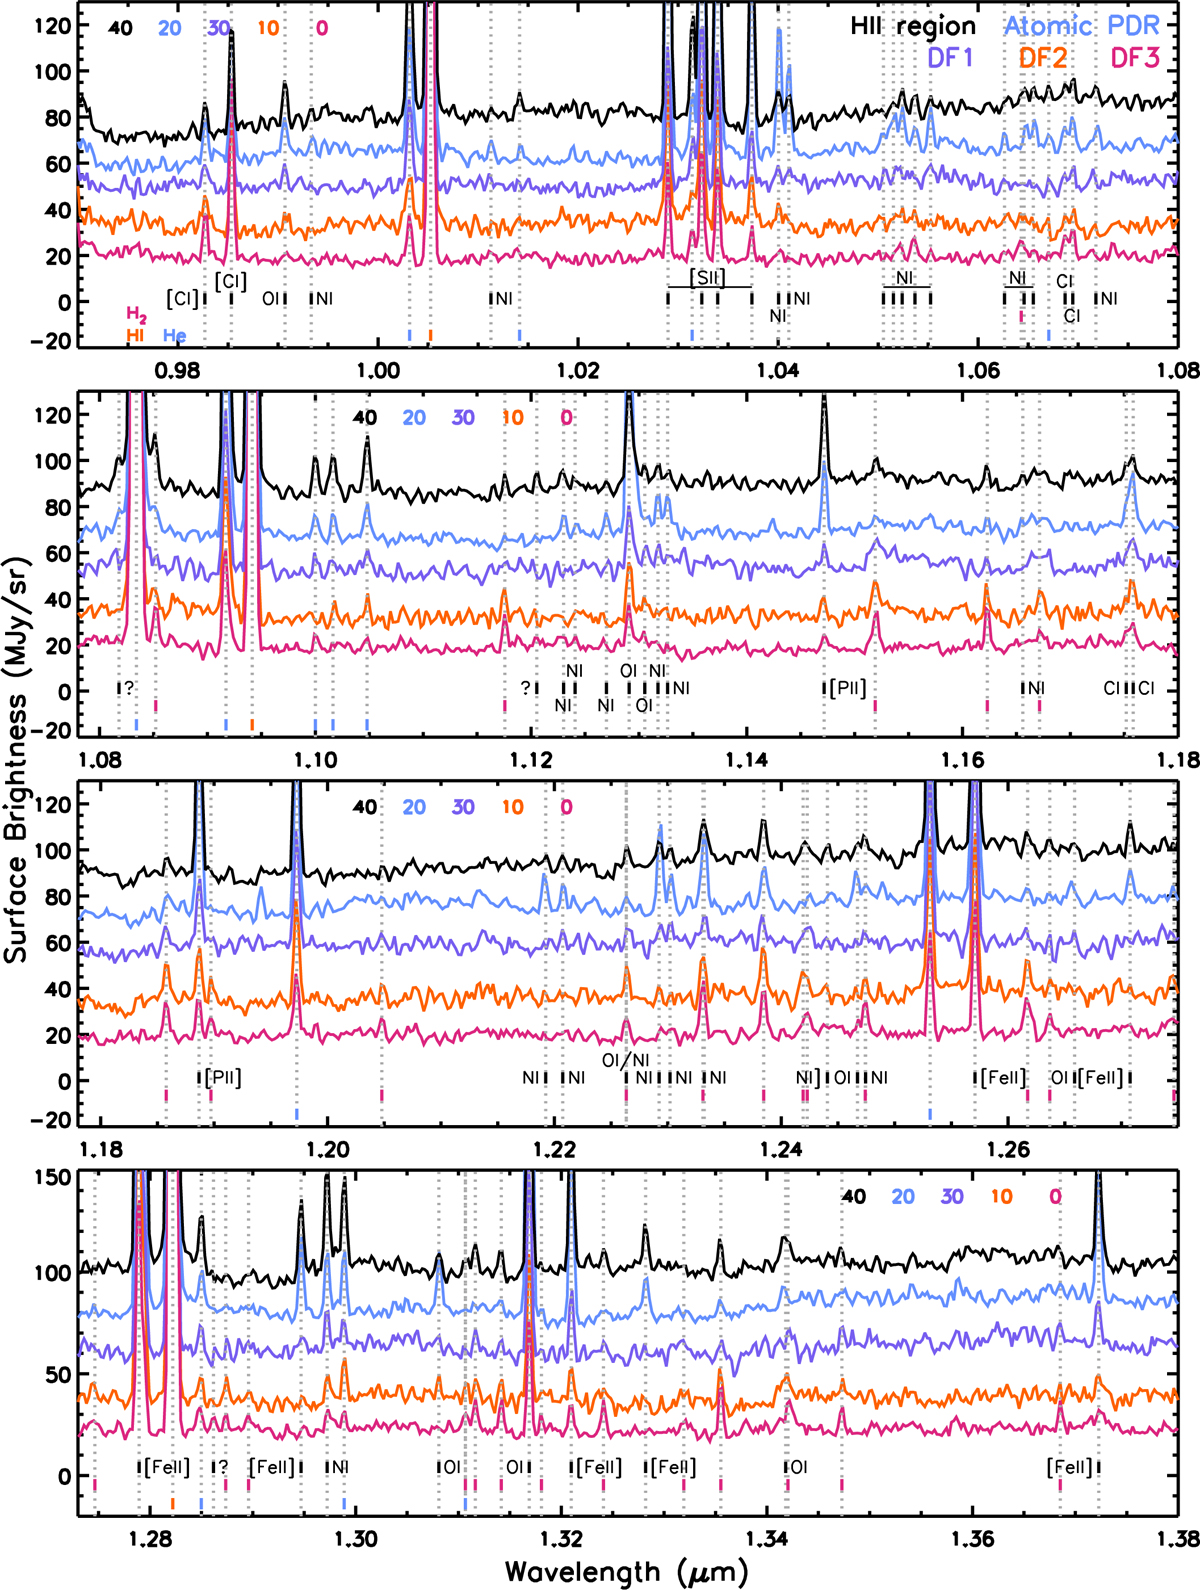
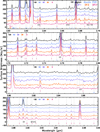
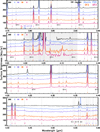
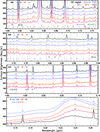
Fig. B.1
Download original image
Spectral inventory of the five template spectra. Spectra are offset by the numbers given at the top of the panel. Areas susceptible to the wavelength gap are shown in light grey. The colour coding is labelled in the top panel.
This figure is made of several images, please see below:

Current usage metrics show cumulative count of Article Views (full-text article views including HTML views, PDF and ePub downloads, according to the available data) and Abstracts Views on Vision4Press platform.
Data correspond to usage on the plateform after 2015. The current usage metrics is available 48-96 hours after online publication and is updated daily on week days.
Initial download of the metrics may take a while.