Fig. 19
Download original image
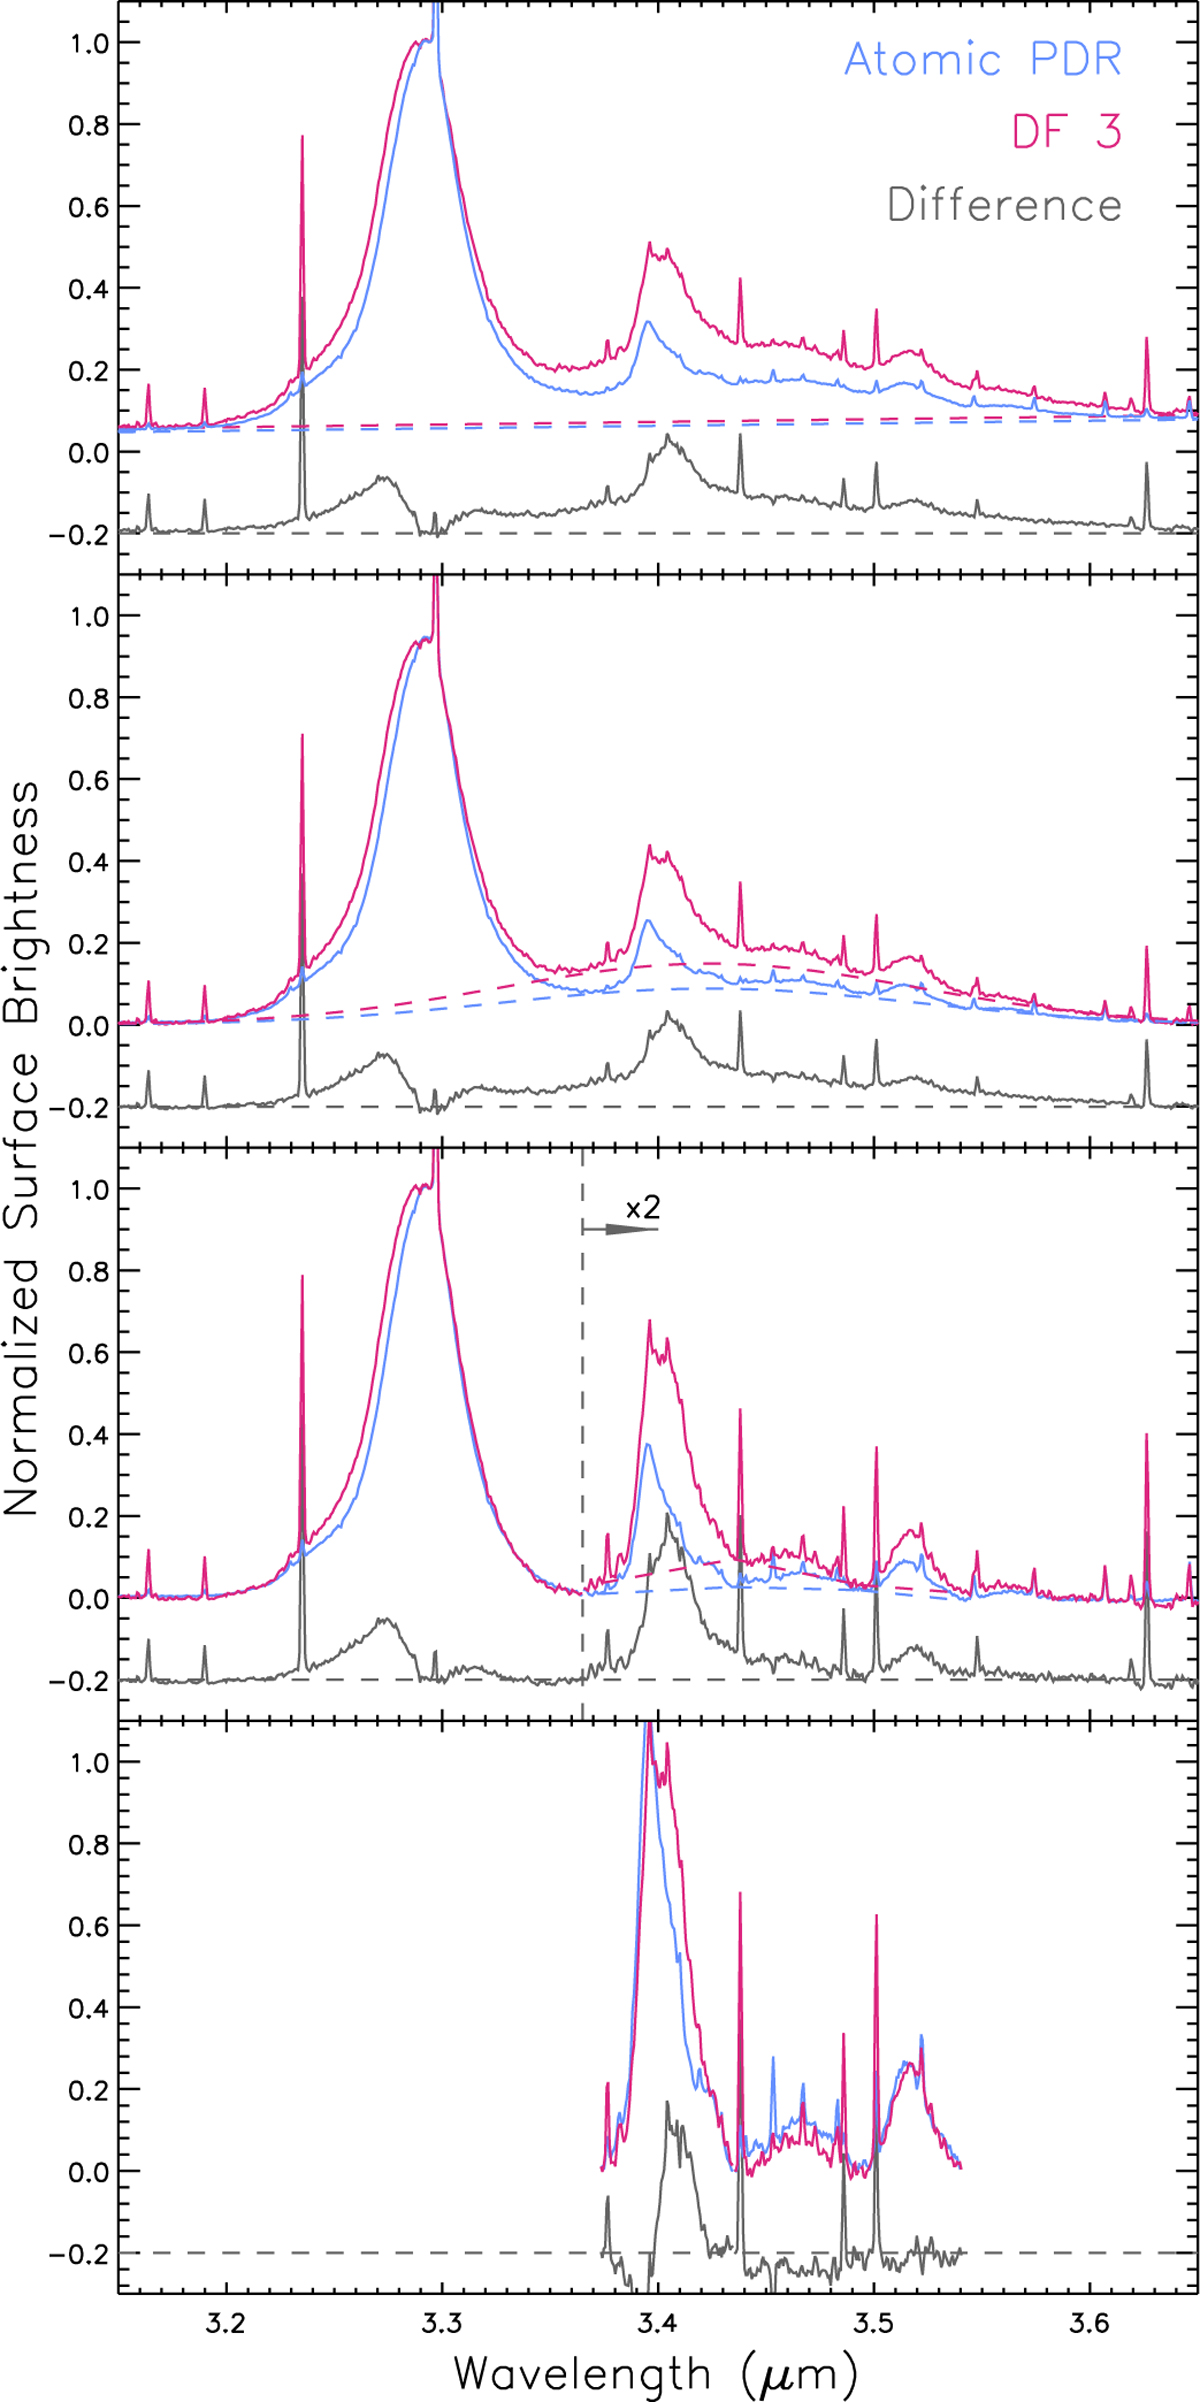
Comparison of the AIBs in the atomic PDR (blue) and DF 3 (red). The difference in their normalised emission is given in grey and the grey dashed line indicates the zero level for the difference spectrum. Top to bottom: template spectra (solid lines) and their respective linear dust continuum (coloured dashed lines); continuum-subtracted template spectra (solid lines) and their respective plateau emission (coloured dashed lines); (continuum+plateau)-subtracted template spectra (solid lines) and their respective local continua for the weaker AIBs (coloured dashed lines); (continuum+plateau+local continuum)-subtracted template spectra. The template spectra are normalised on the peak intensity of the 3.29 µm AIB in the top three panels, and of the 3.40 µm AIB in the bottom panel.
Current usage metrics show cumulative count of Article Views (full-text article views including HTML views, PDF and ePub downloads, according to the available data) and Abstracts Views on Vision4Press platform.
Data correspond to usage on the plateform after 2015. The current usage metrics is available 48-96 hours after online publication and is updated daily on week days.
Initial download of the metrics may take a while.