Fig. 18
Download original image
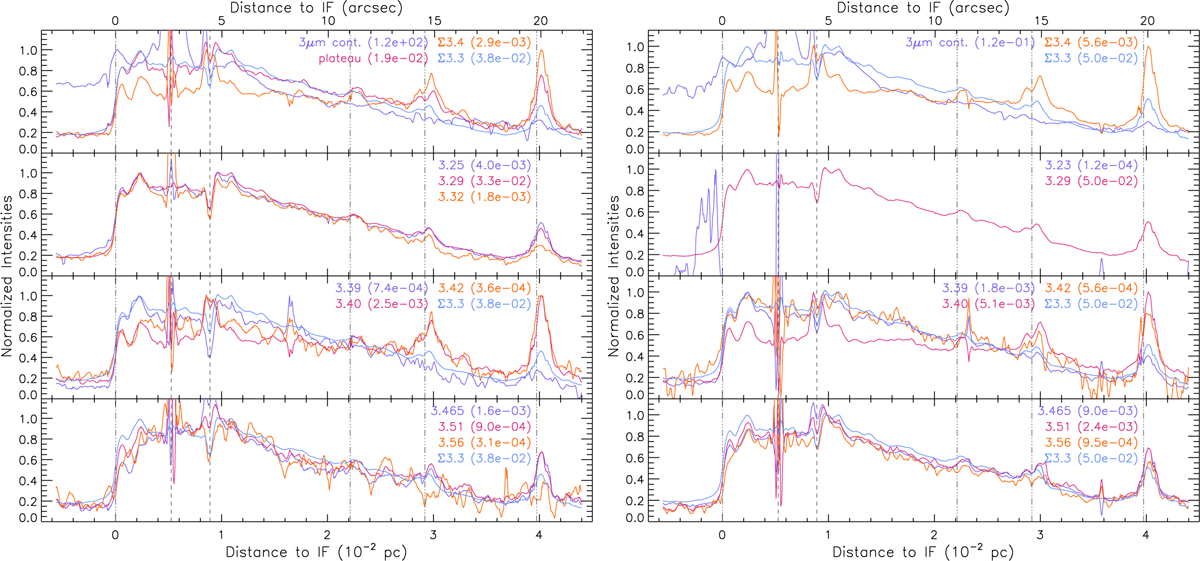
Normalised AIB and continuum intensities from the Gaussian decomposition (left) and the PAHFIT decomposition (right) as a function of distance to the IF (0.228 pc or 113.4″ from θ1 Ori C) along a cut crossing the NIRSpec mosaic (see Fig. 1 ). Normalisation factors are listed between brackets for each intensity. As the cut is not perpendicular to the IF and distances are given along the cut, a correction factor of cos(19.58°)=0.942 needs to be applied to obtain a perpendicular distance from the IF. Σ3.3 reflects the brightness of the 3.25, 3.29, 3.33 µm or 3.23 and 3.29 µm AIBs combined for, respectively, the Gaussian and PAHFIT decomposition. Σ3.4 reflects the brightness of the 3.40, and 3.42 µm AIBs combined. No extinction correction is applied. The dash-dot-dot-dot vertical lines indicate the position of the IF, DF 1, DF 2, and DF 3, respectively, from left to right. The dashed vertical lines indicated the location of the proplyds 203–504 (left) and 203–506 (right). Units are erg cm−2 s−1 sr−1 except for the 3 µm continuum which is in units of MJy sr−1.
Current usage metrics show cumulative count of Article Views (full-text article views including HTML views, PDF and ePub downloads, according to the available data) and Abstracts Views on Vision4Press platform.
Data correspond to usage on the plateform after 2015. The current usage metrics is available 48-96 hours after online publication and is updated daily on week days.
Initial download of the metrics may take a while.