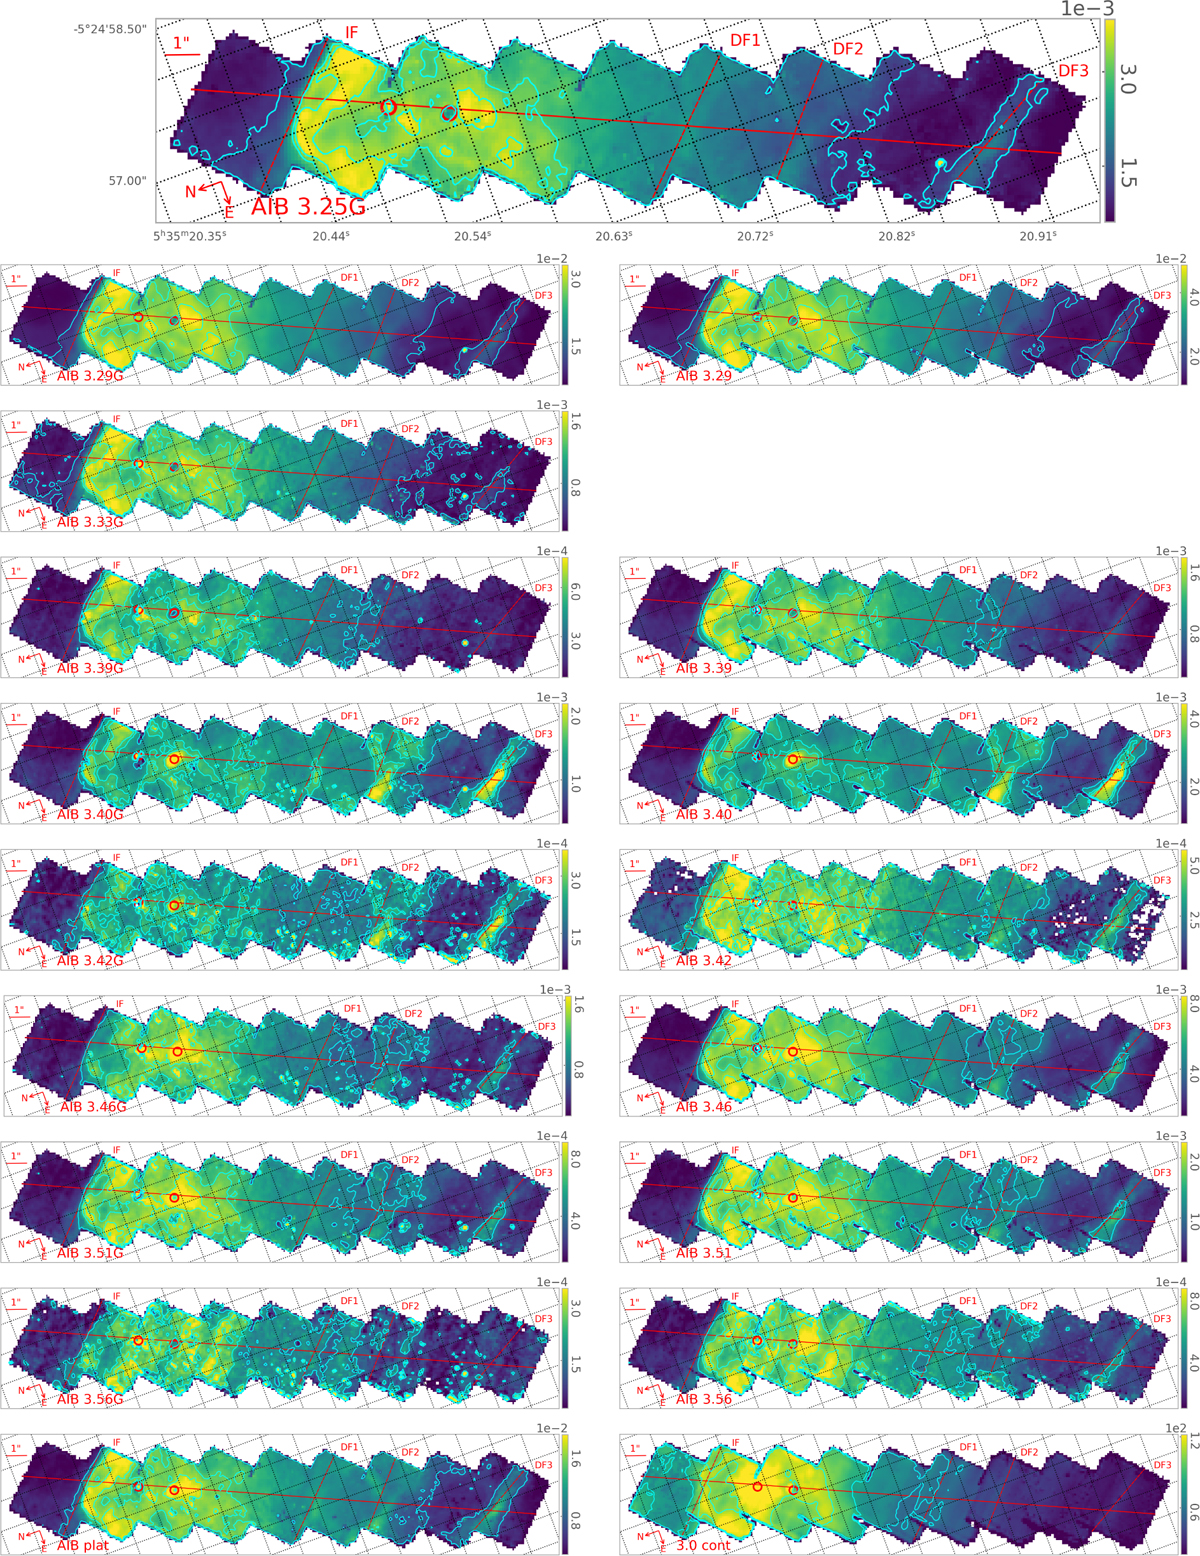
Fig. 17
Download original image
Spatial distribution of the AIB components in the 3.2–3.7 µm range from the Gaussian decomposition (top and left panels) and PAHFIT decomposition (right panels). ‘AIB plat’ refers to the plateau emission (bottom panel, left) and ‘3.0 cont’ to the continuum emission at 3.0 µm (bottom panel, right). Units are erg cm−2 s−1 sr−1, except for the 3.0 µm continuum map, which is in units of MJy sr−1. We set the colour range from the bottom 0.5% to the top 99.5% of data for each map, excluding values of zero, edge pixels, and the two proplyds (as well as the surrounding region of the proplyds for the continuum). White pixels inside the mosaic indicate values of zero reflecting either the component was not used in the fit or issues with the data. The nearly horizontal red line indicates the NIRSpec cut and the nearly vertical red lines indicate from left to right the IF and the DFs (DF 1, DF 2, DF 3). The two proplyds are indicated by the circles. Contours show the 30, 78, 94% of the data for the 3.25G, 3.29/3.29G, and 3.33G components as well as the AIB plat, 50, 78, 93% for the 3.39/3.39G and 3.56/3.56G components, 35, 78, 93% for the 3.40/3.40G and 3.42/3.42G components, 45, 78, 94% for the 3.46/3.46G and 3.51/3.51G components, and 50, 68, 85% for the continuum emission at 3.0 µm. The continuum emission at 3.0 µm from the Gaussian decomposition is shown in Fig. 7.
Current usage metrics show cumulative count of Article Views (full-text article views including HTML views, PDF and ePub downloads, according to the available data) and Abstracts Views on Vision4Press platform.
Data correspond to usage on the plateform after 2015. The current usage metrics is available 48-96 hours after online publication and is updated daily on week days.
Initial download of the metrics may take a while.