Fig. 16
Download original image
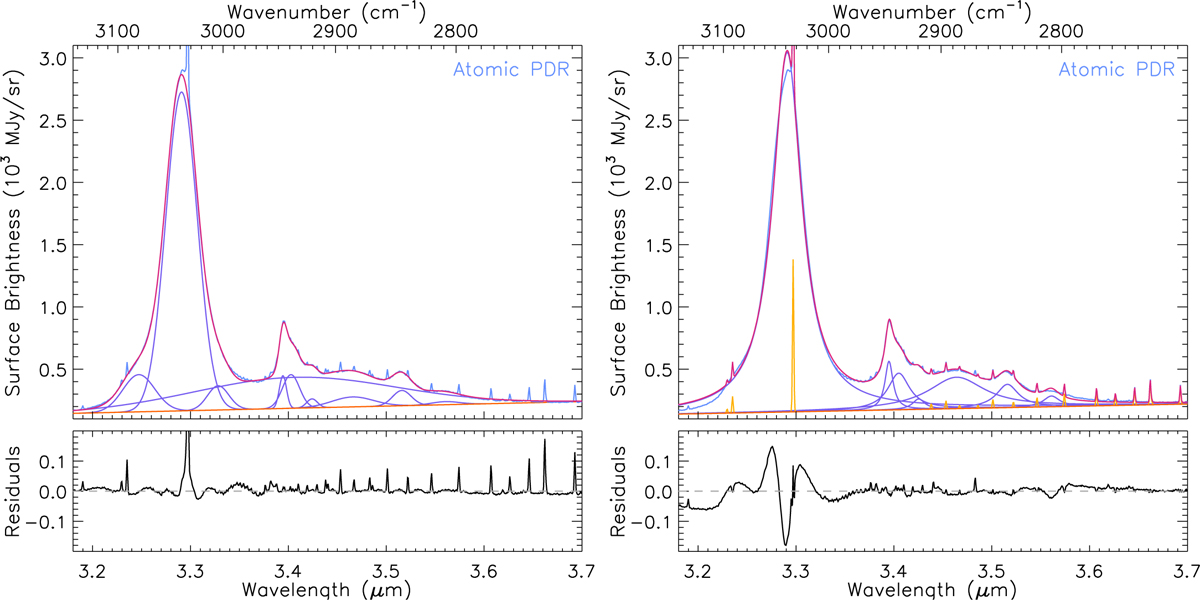
Spectral decomposition of the AIB emission for the atomic PDR by a Gaussian decomposition (left) and by PAHFIT (right). The dust continuum emission is represented by the orange line, the AIB components by the purple profiles, and emission lines by the yellow Gaussians (for the PAHFIT decomposition; the Gaussian decomposition method removes the lines prior to fitting).
Current usage metrics show cumulative count of Article Views (full-text article views including HTML views, PDF and ePub downloads, according to the available data) and Abstracts Views on Vision4Press platform.
Data correspond to usage on the plateform after 2015. The current usage metrics is available 48-96 hours after online publication and is updated daily on week days.
Initial download of the metrics may take a while.