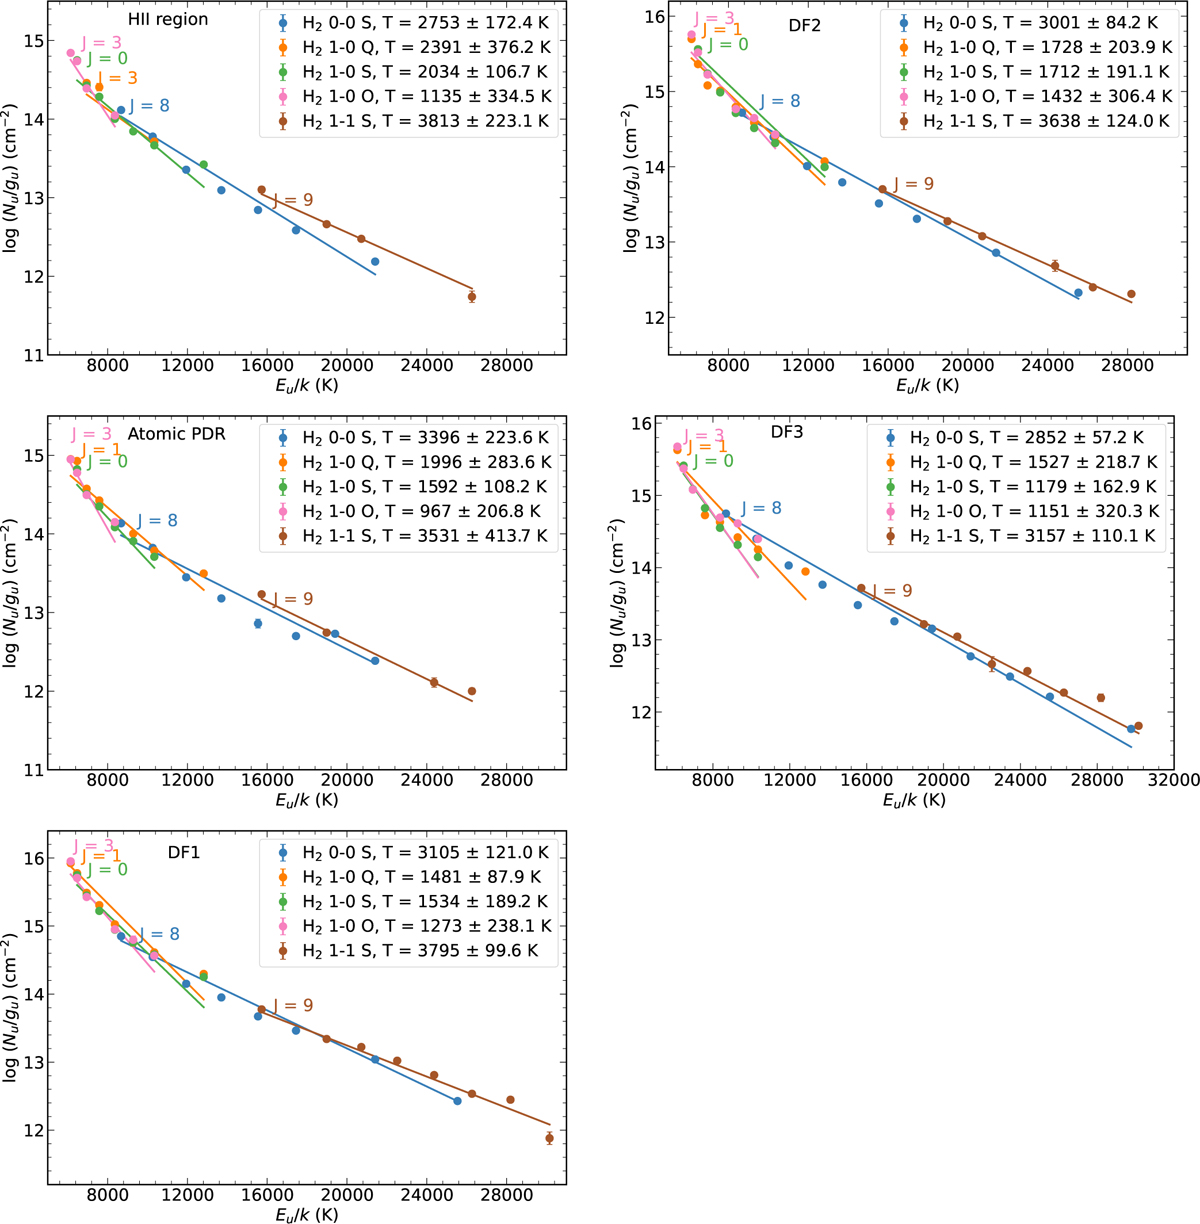
Fig. 15
Download original image
Excitation diagrams of H2 lines observed towards the H II region, atomic PDR, DF 1, DF 2, and DF 3. With the exception of H II region, the H2 lines in the excitation diagrams are first corrected for foreground visual extinction and subsequently for extinction within the PDR using the intermingled formalism. In H II region the lines are only corrected for the foreground visual extinction. The excitation diagrams for the 0–0 S, 1–0 Q, 1–0 S, 1–0 0, and 1–1 S levels of H2 are fitted using a single temperature component of the gas, and the individual fits are represented by solid lines. The resulting temperature and column densities obtained from the fits are listed in Table 4.
Current usage metrics show cumulative count of Article Views (full-text article views including HTML views, PDF and ePub downloads, according to the available data) and Abstracts Views on Vision4Press platform.
Data correspond to usage on the plateform after 2015. The current usage metrics is available 48-96 hours after online publication and is updated daily on week days.
Initial download of the metrics may take a while.